Candlestick charts are a huge part of technical analysis. They allow you to make accurate predictions of future market behavior. If you’re new to technical analysis, don’t worry, we’ve got you covered. In this article, you’ll learn all the candlestick basics and you’ll be one step closer to becoming an expert in the technical analysis of cryptocurrency.
What are crypto candlestick charts?
Crypto candle charts give you a visual analysis of crypto market movement. They display the movement in the price of a token and they’ve been around for over a hundred years! They show you the price performance (rise or fall) of a token over a specific amount of time. There are several different patterns to look out for and each pattern indicates a different reading of the price of a cryptocurrency.
We’ll go into more detail about patterns later and how to start reading crypto candlesticks.
What’s the history behind the candlestick crypto chart?
Candlesticks originated in Japan over 100 years ago. Before candlestick charts were used for cryptocurrency and stocks, Japanese rice merchants and traders used candlestick charts to track market prices and daily momentum. They found that the influx in the price of rice varied depending on supply, demand, and trader’s emotions. The candlestick chart displays this variance by showing the size of price movement with different colors. Trading decisions were made based on regularly occurring patterns that forecast the short-term direction of the price.
Candlesticks were later introduced to the Western world in 1991 when Steve Nison published his book Japanese Candlestick Charting Techniques. They’ve been used for stock markets and crypto price predictions ever since.
But, why are they so important today?
Why are crypto candle charts so important?
Crypto candle charts are a really important part of technical analysis. But why? Many algorithms are based on price information provided by candlestick charts. The fact that makes them so important is that they show all four price points (high, low, open, and close) throughout the period of time that you specify. By looking at the patterns shown in crypto candle charts, traders can make accurate predictions based on previous market price fluctuations.
Crypto candle components and what they mean
The candlestick crypto chart indicators are the real body, wick, shadow, and color indication of the chart. These components combined tell traders how a cryptocurrency’s price has performed that day.
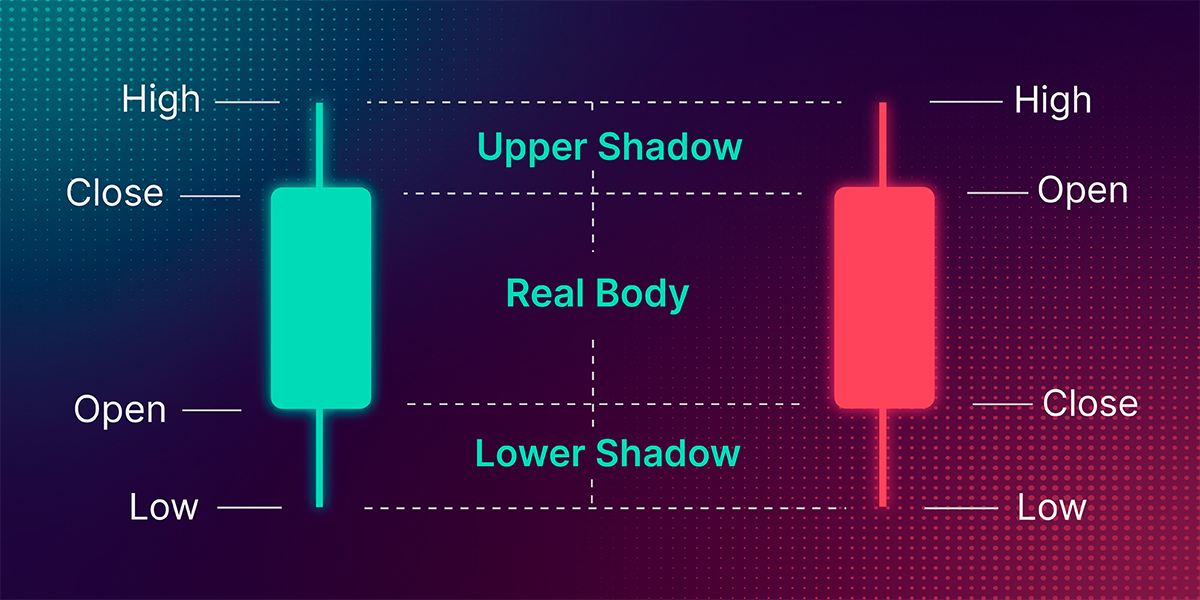
The wide part of the candlestick body is called the real body, and this indicates if the closing price was higher or lower than the opening price. The color of the body can vary between platforms, but usually the body will be red if the price closes at a lower price, or it will be green if the price closes higher. So, if the body is filled in, the price has decreased. However, if it’s empty, it’s increased. Additionally, real bodies can be long or short.
The top of the candle chart indicates the highest price for the day, whereas the bottom of the chart indicates the lowest. This part of the real body is the candlestick wick (sometimes referred to as a candlestick shadow). Wicks can be long or short and indicate where the price was at the time of the candle forming. If the upper wick on a down candle is short, it indicates that the price was near the high of the day. A short upper wick on an up day shows that the close was near the high.
Now that you know all the candlestick basics, it’s time to see how they compare to other types of charts.
Candlesticks vs line charts and bar charts
Candlesticks, lines, and bar charts can show the same information in different ways. It’s about how they deliver the information visually. Some traders will find it easier to read a crypto candle chart than a line chart.
But, what are the key differences between them?
Candlestick charts. Due to color coding and thicker real bodies, candlesticks are considered the most visual of the three charts. Line charts. This chart limits the number of data points you can view; a line chart only gives you one data point at any given time. Bar charts. This chart emphasizes the closing price of crypto before the time period ends.
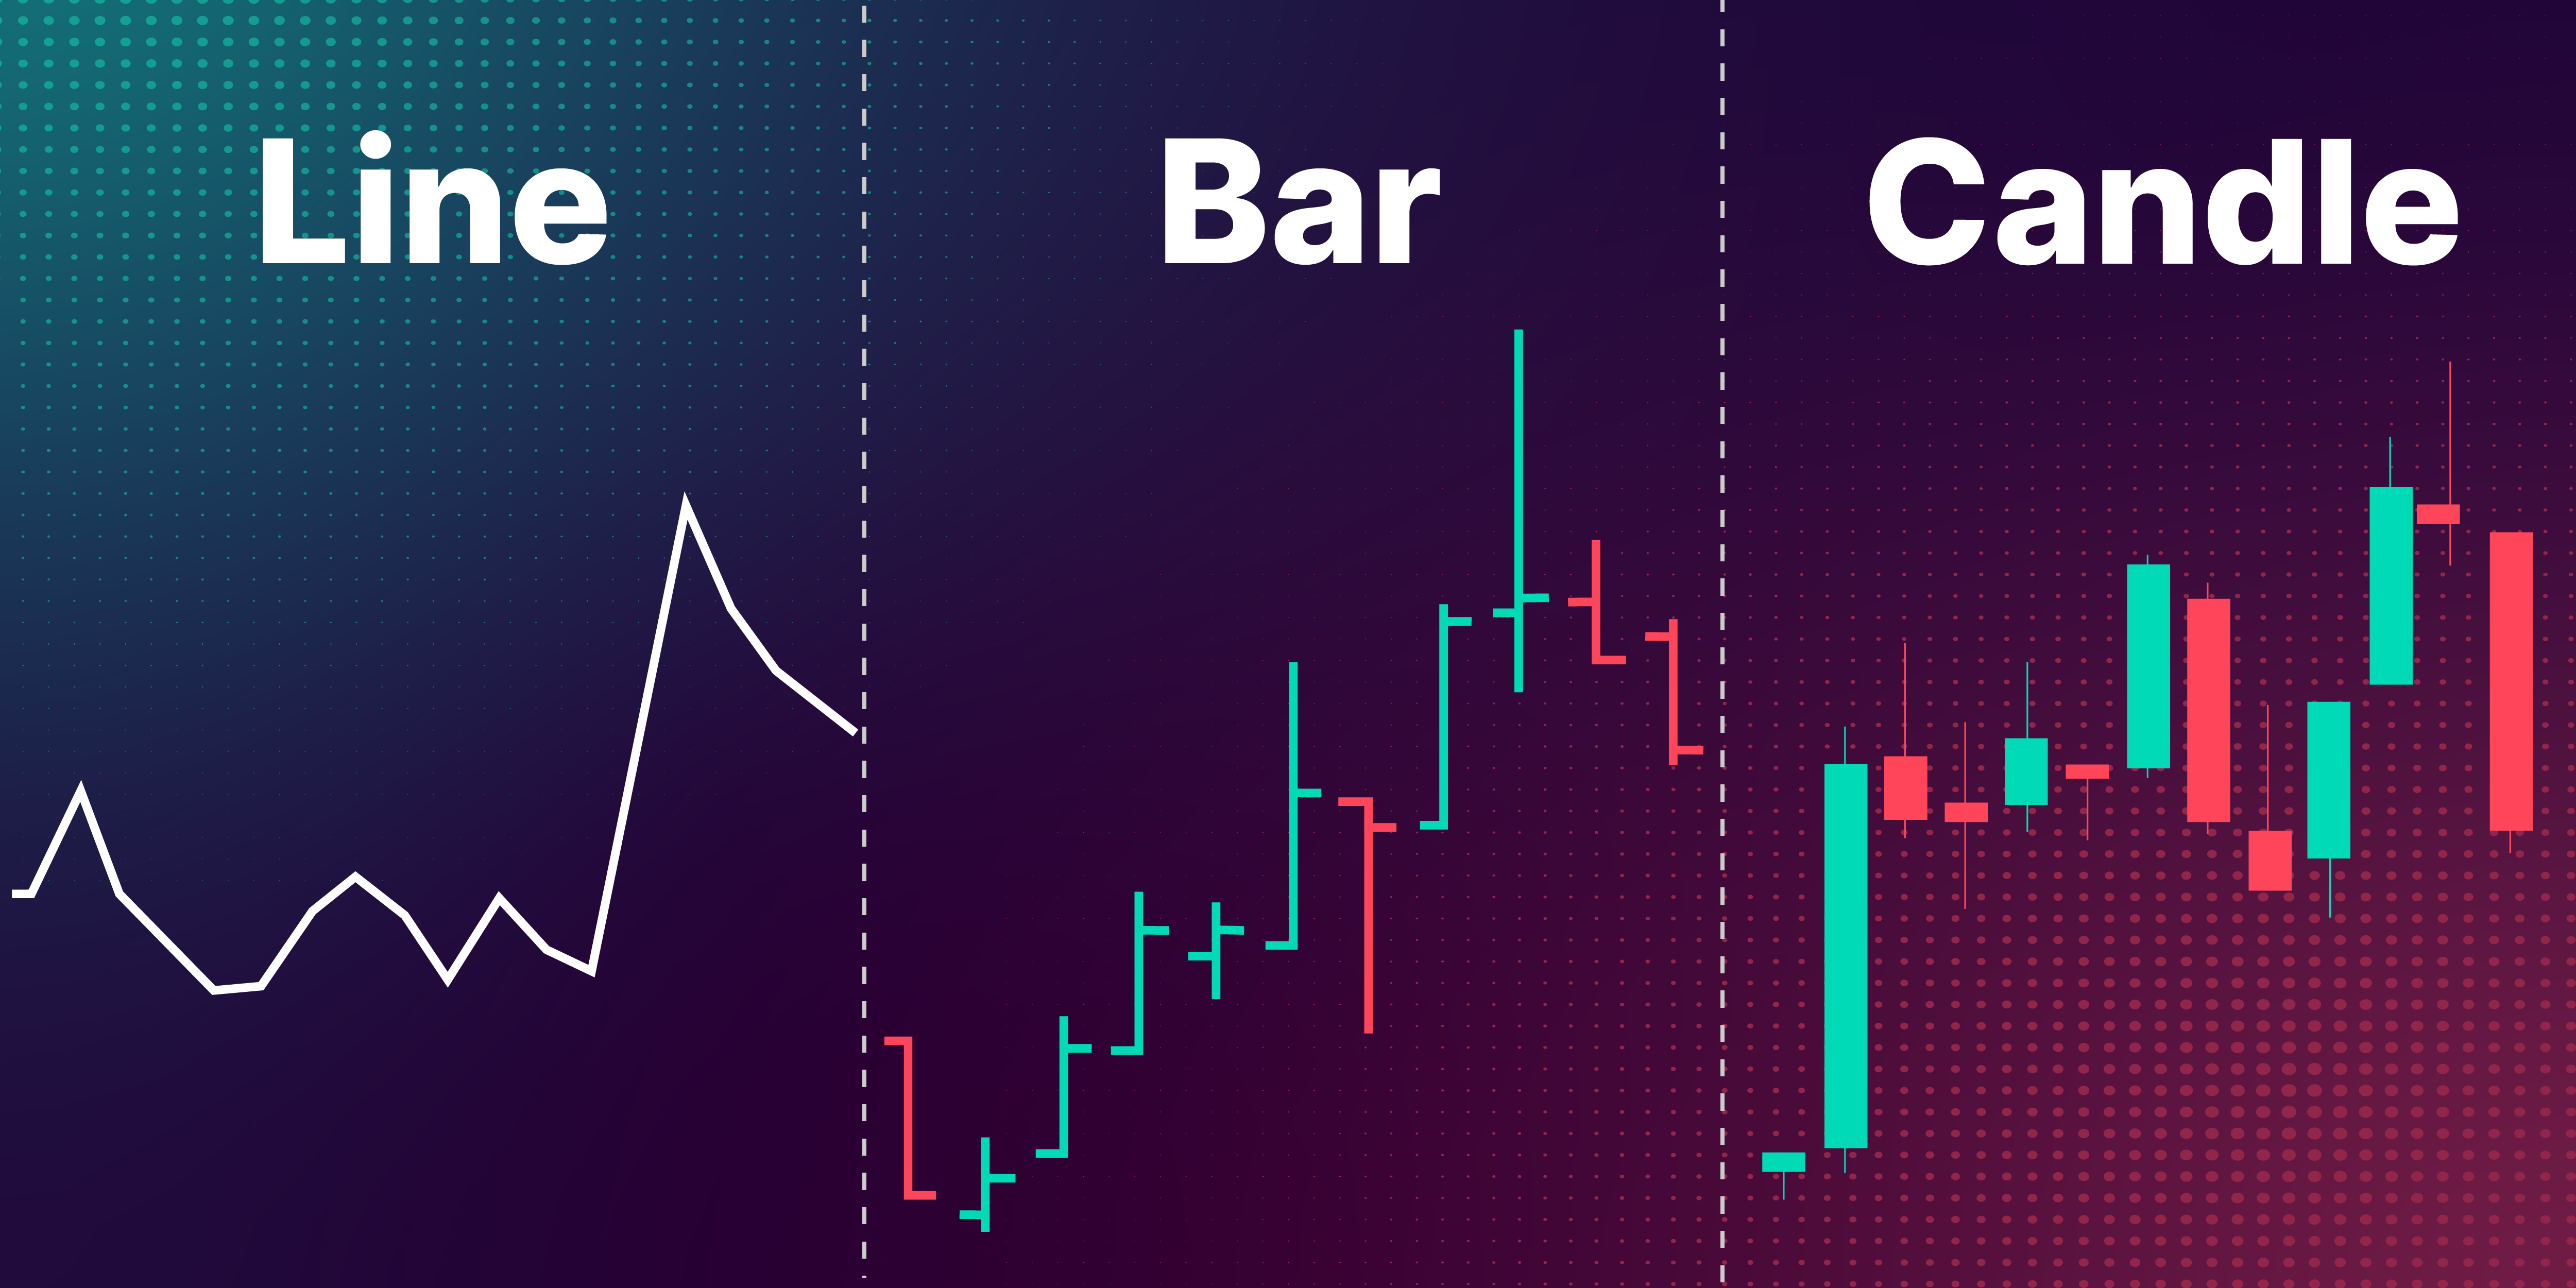
We recommend you use a mixture of all three charts to enhance your market predictions. You can never have too much data, right? If, like us, you prefer crypto candle charts then read on to discover the most useful candlestick crypto patterns.
The most famous candlestick crypto patterns
Candlesticks are created when crypto prices move up and down, and movements can be random. However, more often than not a pattern can form. Crypto candlestick patterns are fascinating to look at if you know how to read them. Patterns are typically separated into two categories: bullish candlestick patterns and bearish candlestick patterns.
Bullish engulfing pattern
Bullish candlestick patterns indicate that the price of a cryptocurrency is likely to rise. A bullish engulfing pattern occurs when buyers outpace sellers. The chart reflects this in a long white real body engulfing a small black real body. As the bulls establish some control, this means the price could continue to increase.
There are various bullish patterns such as harami, harami cross, and rising three.
Bearish engulfing pattern
Bearish candlestick patterns indicate that the price of a cryptocurrency is likely to fall. Bearish engulfing patterns occur when sellers outnumber buyers. The chart reflects this in a long black real body engulfing a small white real body. This pattern indicates sellers are in control, and that the price could decline further.
There are various bullish patterns such as evening star, harami, harami cross, and falling three.
Doji candlestick pattern
Doji in Japanese refers to a blunder or mistake. This is a rare occurrence in the crypto market. A doji candle occurs when a cryptocurrency’s open and closed prices are virtually equal. Doji is considered a neutral pattern.
Doji comes in three main patterns such as dragonfly, gravestone, and long-legged.
It’s important to note: crypto-chart patterns don’t work every time. As the market can be volatile, following a pattern isn’t a guaranteed prediction. Please be aware of this and trade responsibly.
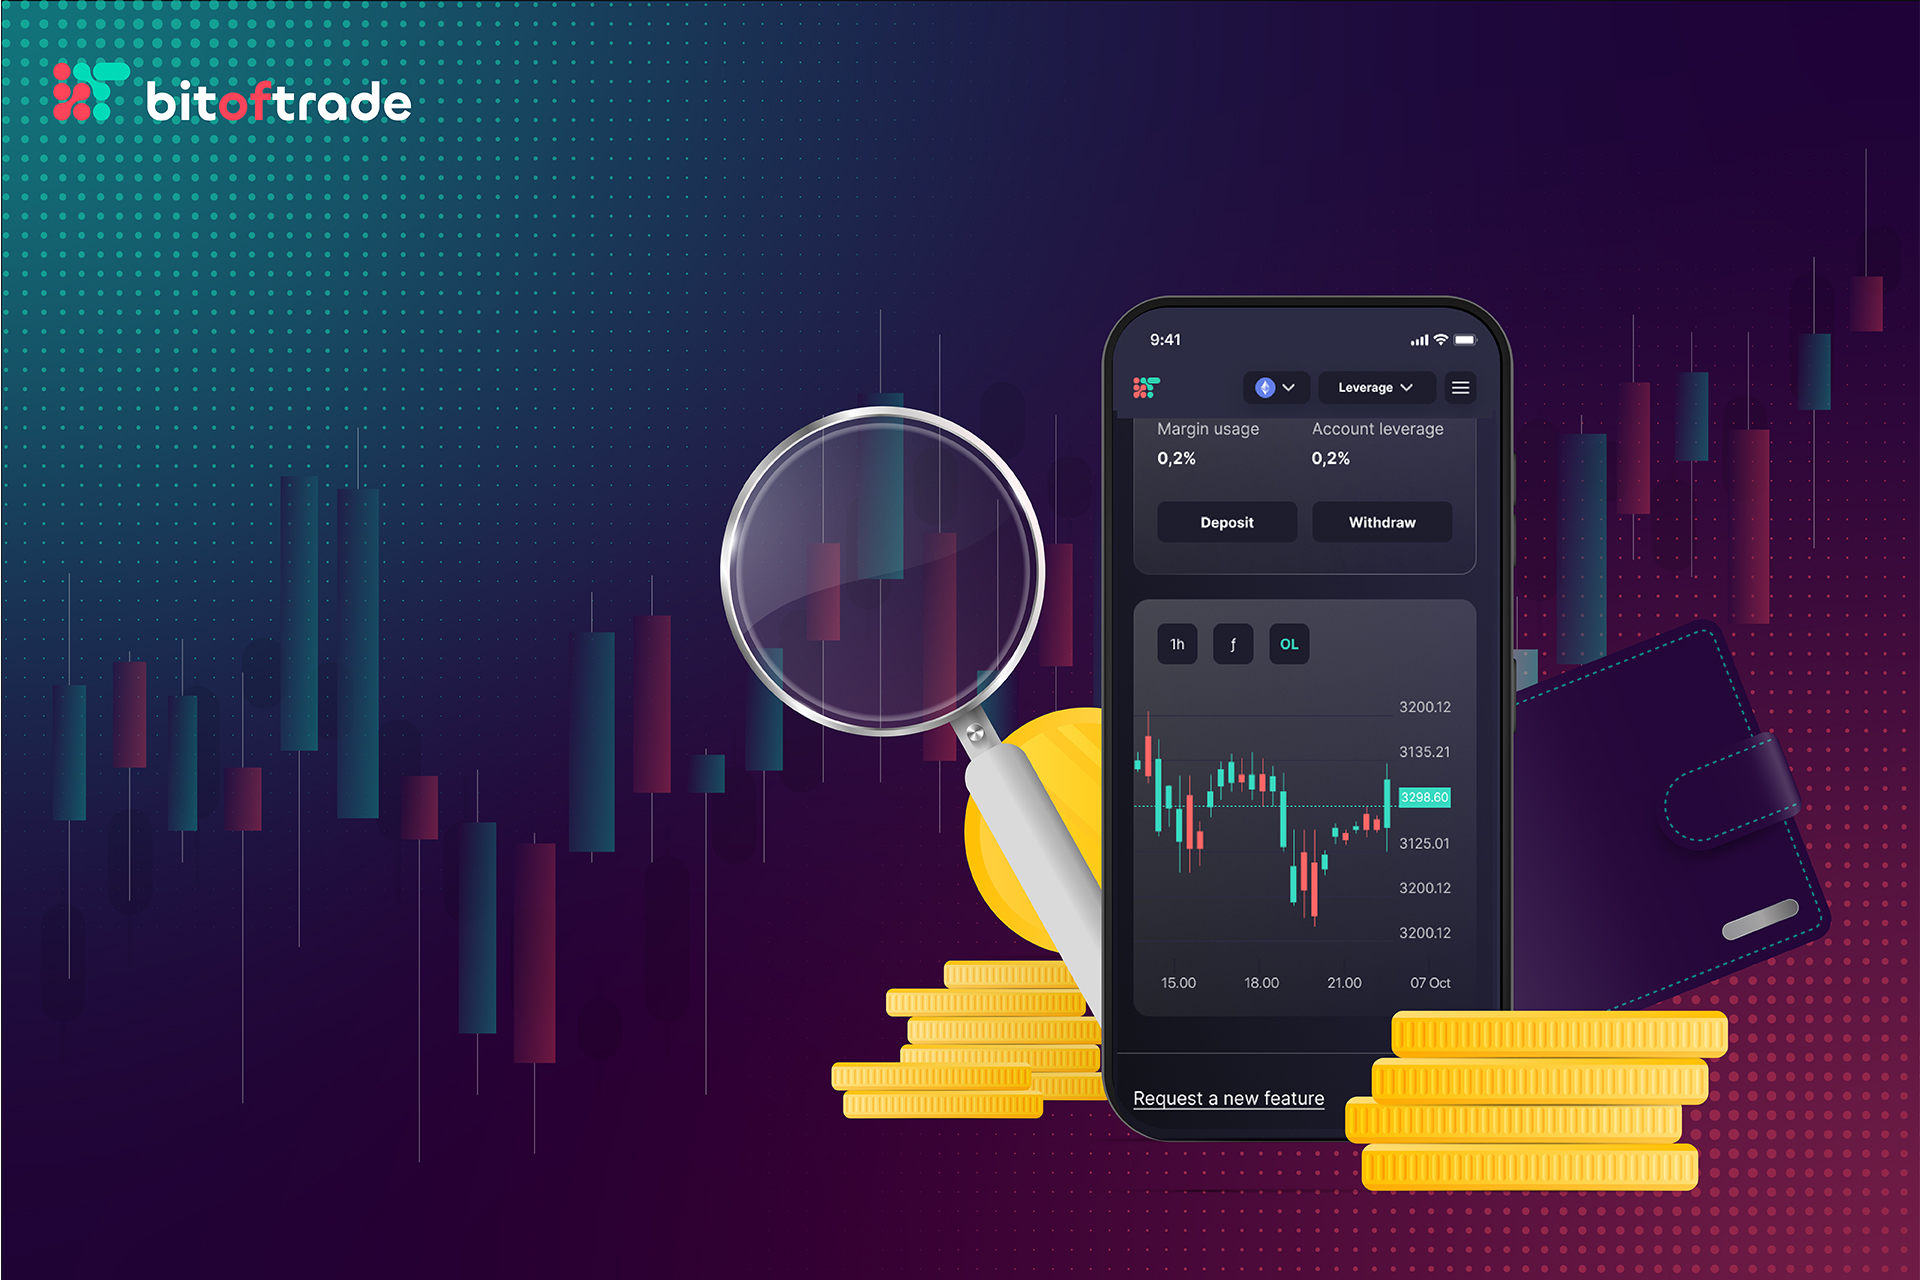
Cryptocurrency candlestick charts coming soon to bitoftrade
bitoftrade is excited to announce that cryptocurrency candlestick charts are coming to the trading platform soon! Not only can you trade over 900 tokens on our platform, but you’ll also be able to use our crypto candles to inform your market predictions.
Our decentralized platform has advanced features that'll make trading easier for you, all you’ll need to do is connect your MetaMask and you can get started! We follow a strict no KYC policy, so you can trade anonymously confidently. Additionally, you can choose from a range of trading types such as leverage and swaps with small fees on various networks such as Avalanche, Polygon, Ethereum, Fantom, and BSC.
Start trading on the bitoftrade platform today!
Exciting projects are coming to the platform, and you can influence our platform features! Do you think our platform is missing something? Suggest a feature, or vote on suggestions that our community has already made here. Expect to see new features launching on our platform such as stop-loss trading, hedging, and more very soon.
If you want to stay in the loop with all things bitoftrade check out all of our community Channels and join in the conversation:
Official bitoftrade Telegram channel
Official bitoftrade Discord channel
Find us on social media!
Find us on LinkedIn
Find us on Twitter
Find us on YouTube