There are multiple tools that traders, day traders, and technical analysts use to help identify chart patterns, which may help to generate buy or sell signals as well. Technical indicators are widely used to determine supply and demand, as well as market psychology. Regardless of the supply, demand, and market psych, one of, if not the most important metrics is volume.
One of the most used technical analysis tools is oscillators which have variations such as the stochastic oscillator, the relative strength index (RSI), and the moving average convergence divergence (MACD). Besides the oscillators, there are overlays that include Fibonacci lines, Bollinger bands, and moving averages. Additionally, there is the average directional index (ADX), the accumulation/distribution line (A/D line), the Aroon indicator, and others. There is no shortage of different things to look at while trying to chart cryptocurrencies, but choosing the correct tools and knowing how to use them is a different story. Today we will look in-depth into one of the most popular crypto technical indicators, the stochastic oscillator, and its different variations.
As we go in-depth looking at the stochastic oscillator, different strategies and stoch RSI don’t get too overwhelmed. While it seems as though these formulas are quite complex, most indicators are already programmed into sites like tradingview.com. Remember the main thing that this indicator and its variations show is simply if an asset or cryptocurrency is either overbought or oversold. Knowing when these things occur can help to make a stronger and more knowledgeable trader, especially trading on bitoftrade.
What Is Stochastic Momentum Indicator (Stoch)?
First, let's define stochastic indicator or, in particular, the stochastic momentum index (SMI). This indicator was first used in the late 1950s and was developed by George Lane. Lane made clear over numerous interviews that the stochastic oscillator does not follow price, volume, or anything similar. He indicated that the oscillator follows the momentum or speed of price. Lane also stated in interviews that, as a rule, the speed or momentum of the price of an asset or, nowadays, cryptocurrency changes before the price changes itself. The term stochastic refers to the point of a current price in relation to its price range over a period of time. This method attempts to predict where price turning points will be by comparing the closing price of an asset or cryptocurrency to its price range.
While both the stochastic oscillator and SMI indicate momentum, the oscillator is a more basic tool that considers the closing price based on a given period, such as a day, week, month, or even year. In comparison, the SMI is more complex and takes more values into consideration. Since there are more values added to the equation, the SMI produces an average or median of the high/low range of price movements during the time period.
Stochastic Oscillator Formula
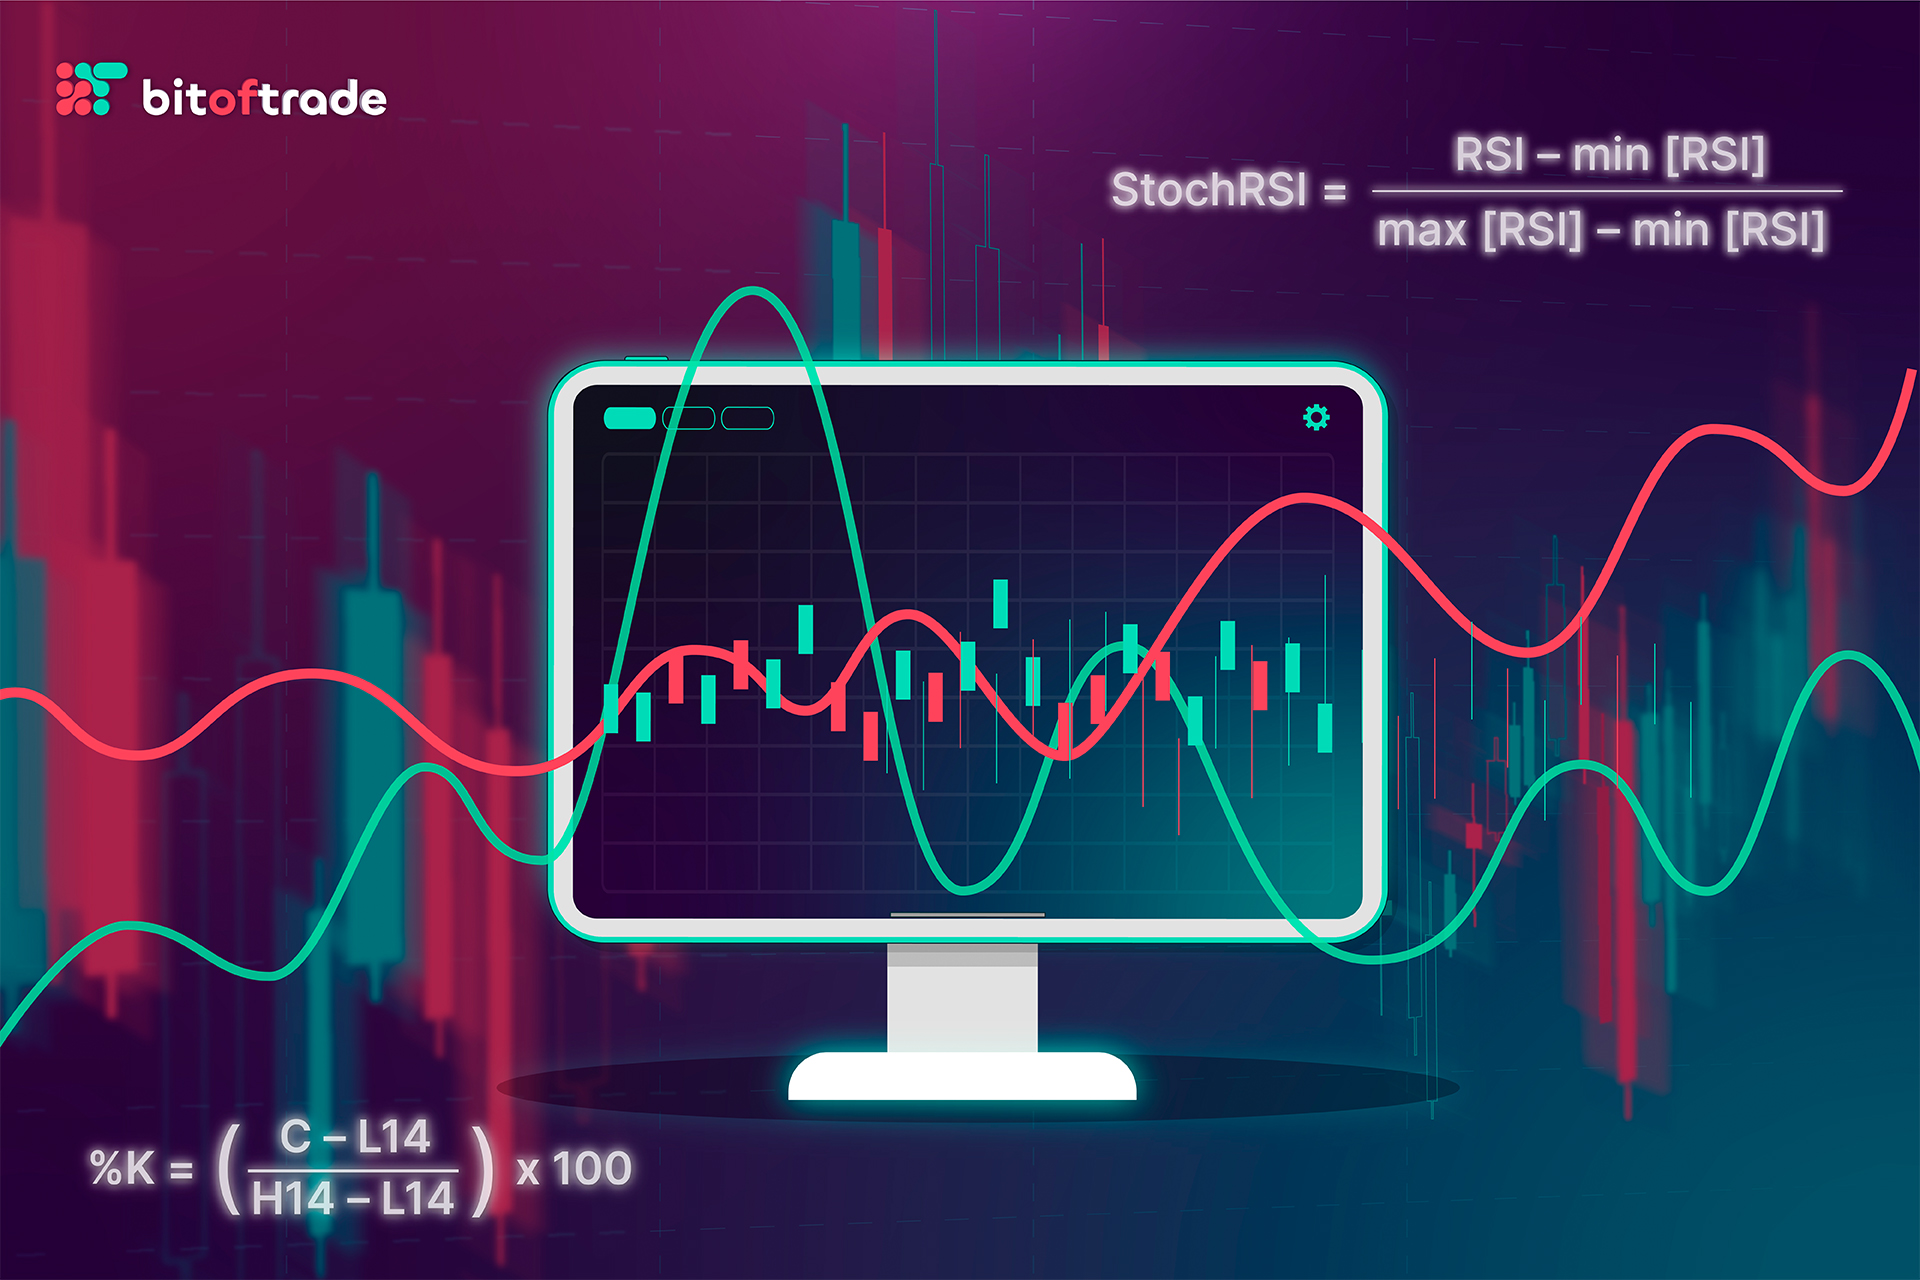
In reference to George Lane's version of the stochastic oscillator or stoch, the general formula used was based on 14 days. The general stochastic indicator formula for his version is below, and this is also referred to as the fast stochastic oscillator, which will be addressed more later:
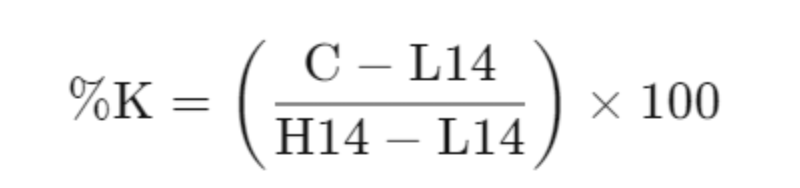
Using this formula, C refers to the most recent closing price. L14 references the lowest price traded of the previous 14 trading sessions. H14 refers to the highest price traded during the same previous 14 trading sessions. %K (Stochastic Main Line) is the current value of the stochastic oscillator.
Additionally, there is %D (Stochastic Signal Line). %D refers to a 3-period simple moving average (SMA) of %K. This is also called the slow stochastic (Remember, the above formula is also referred to as fast stochastic) because of its slower reactions to market price changes when compared to %K.
How to Read the Stochastic Oscillator?
For those of you who are looking at this formula and shaking your heads, let's try to explain what this means in more basic terms. The stochastic oscillator is a range-bound indicator. This means that it always ranges between 0 and 100. This makes it very useful as an indicator that can show both overbought and oversold conditions. Historically, readings that are over 80 are considered to be in the overbought range. Conversely, readings that are under 20 are considered to be in the oversold range. It is important to note that these are not always indicative of any sort of guaranteed reversal. Also, keep in mind that very strong trends can maintain overbought or oversold conditions for an extended period of time. As a trader, you should always look to changes in the stochastic chart for clues about possible future trend shifts.
Best Stochastic Oscillator Settings
Choosing the best stochastic settings is what everyone wants to know but cannot easily be answered. It really depends on what type of trader you are and which stochastic oscillator you want to use, whether it be fast, slow, or full.
With that being said, the standard setting for the slow stochastic oscillator is 5.3.3. The other two most used stochastic settings tend to be 8.3.3 and sometimes 14.3.3. When making the settings that suit your trading style, you have to consider how much "noise" you are willing to encounter from the stoch. If you set low values for the stochastic oscillator, the indicator will become super sensitive. This means it will provide lots of signals but will also produce a lot of "market noise." If high values are set for the stoch, it will become less sensitive to all of the "market noise." This will produce fewer signals since the "market noise" is smoothed out.
As a majority of crypto traders tend to be swing or position traders, it is best to eliminate market noise. The best way to do this is to use the higher settings on the stoch to achieve this.
Slow Stochastic
The slow stochastic is less sensitive than the fast stochastic, as mentioned earlier. The reason is that the slow one uses a moving average while the fast uses the most recent price data. Again, as previously mentioned, the slow stoch will tune out the market noise and become smoother. Additionally, while it may take more time to produce signals, it also tends to be more accurate. Many times in trading, patience is key.
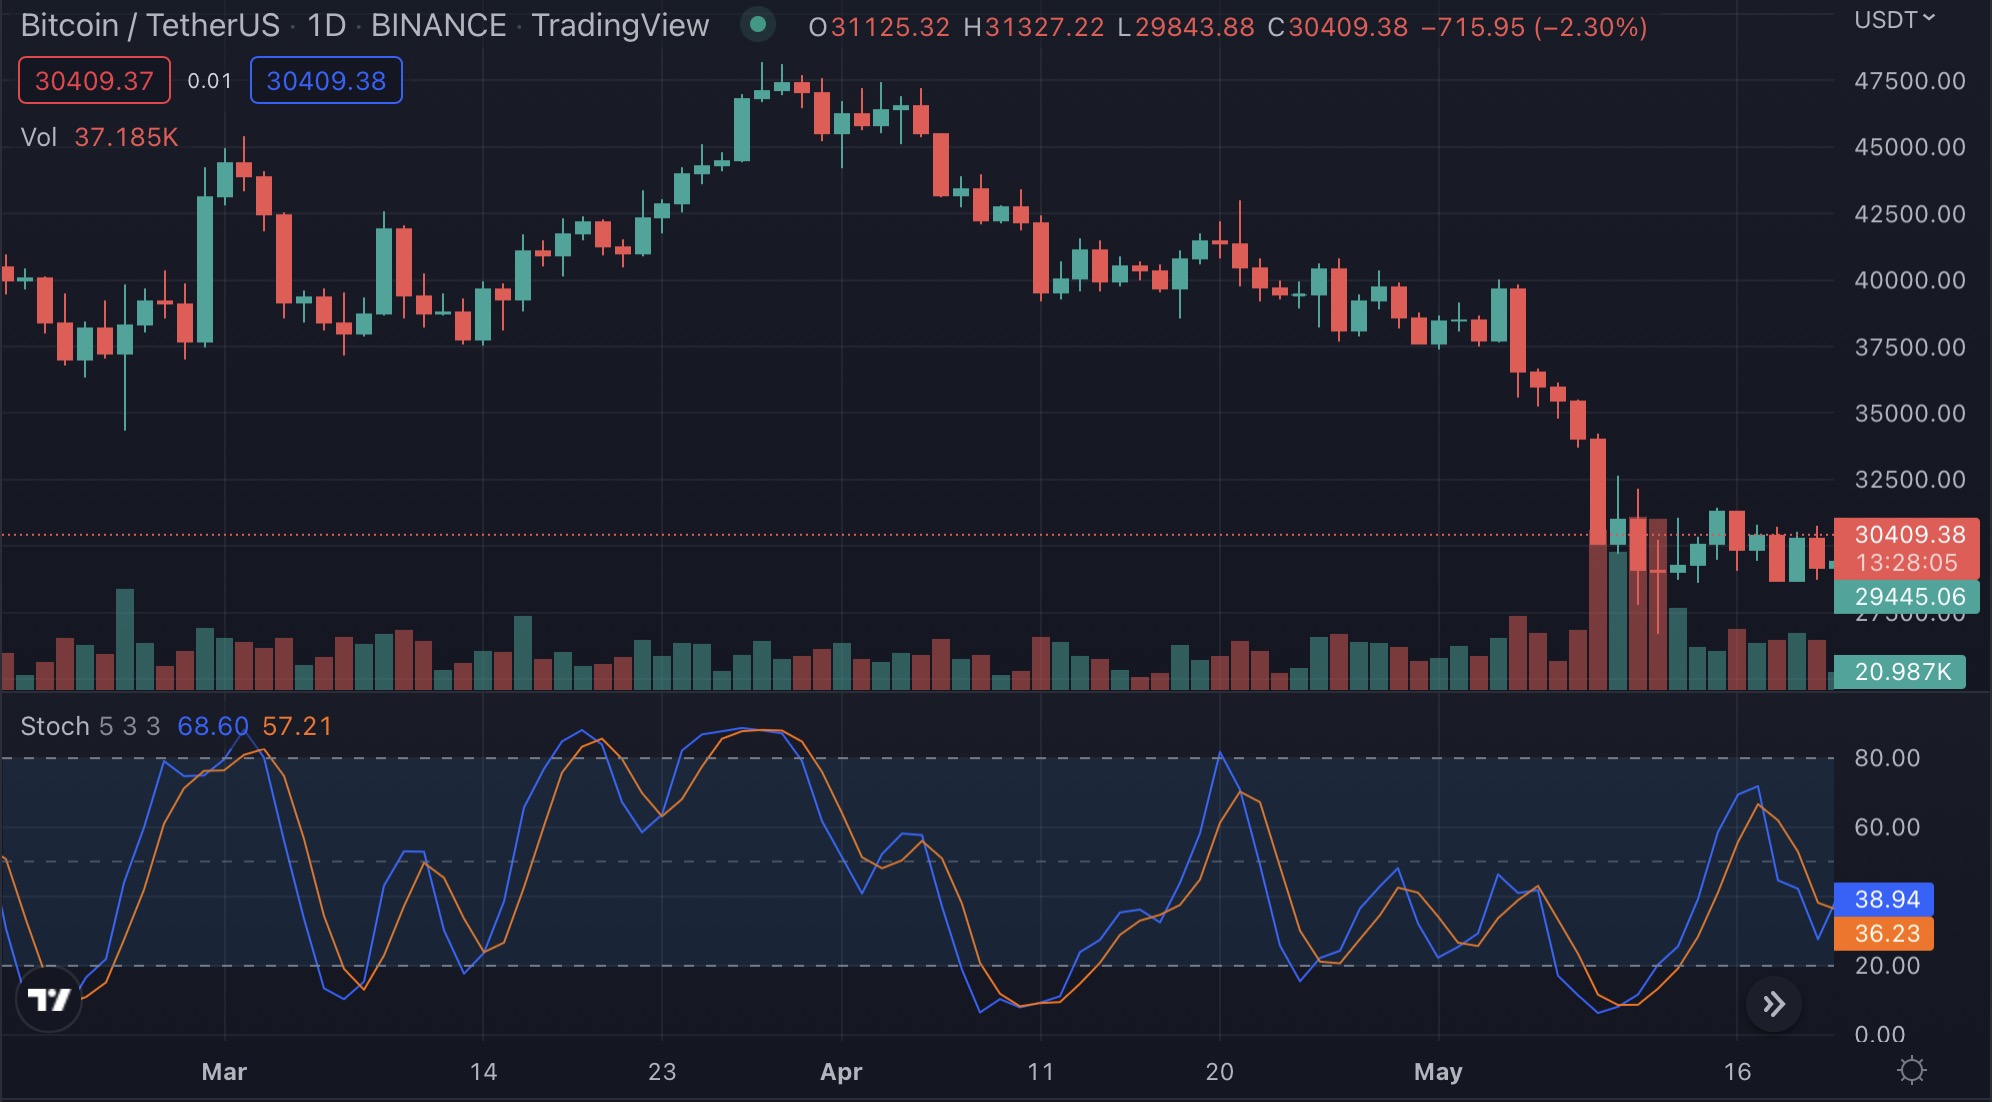
The standard slow stochastic settings, as previously mentioned, should be 5.3.3. Let's break this down in slightly more detail, and remember to use the formula provided earlier in the article!
- %K should be 5 days
- %K for slowing periods should be 3 days
- %D should be 3 days
- All of these should be simple moving averages, and the overbought and oversold ranges slightly differ. The overbought zone should be above 70, and the oversold zone should become below 30.
Here, we have a chart showing the stochastic oscillator with 5.3.3 settings.
Now, let's see how the fast stochastic oscillator (FSTO indicator) works!
Fast Stochastic
Once again, as previously mentioned, the fast stochastic uses the most recent price data instead of a moving average, and this was the formula developed by Lane in the late 1950s. The formula used for this is the one stated in section 2 of the article. This version of stochastic oscillator tends to react more quickly with timely signals, produces much more "market noise," and, as a result, tends to produce more false signals.
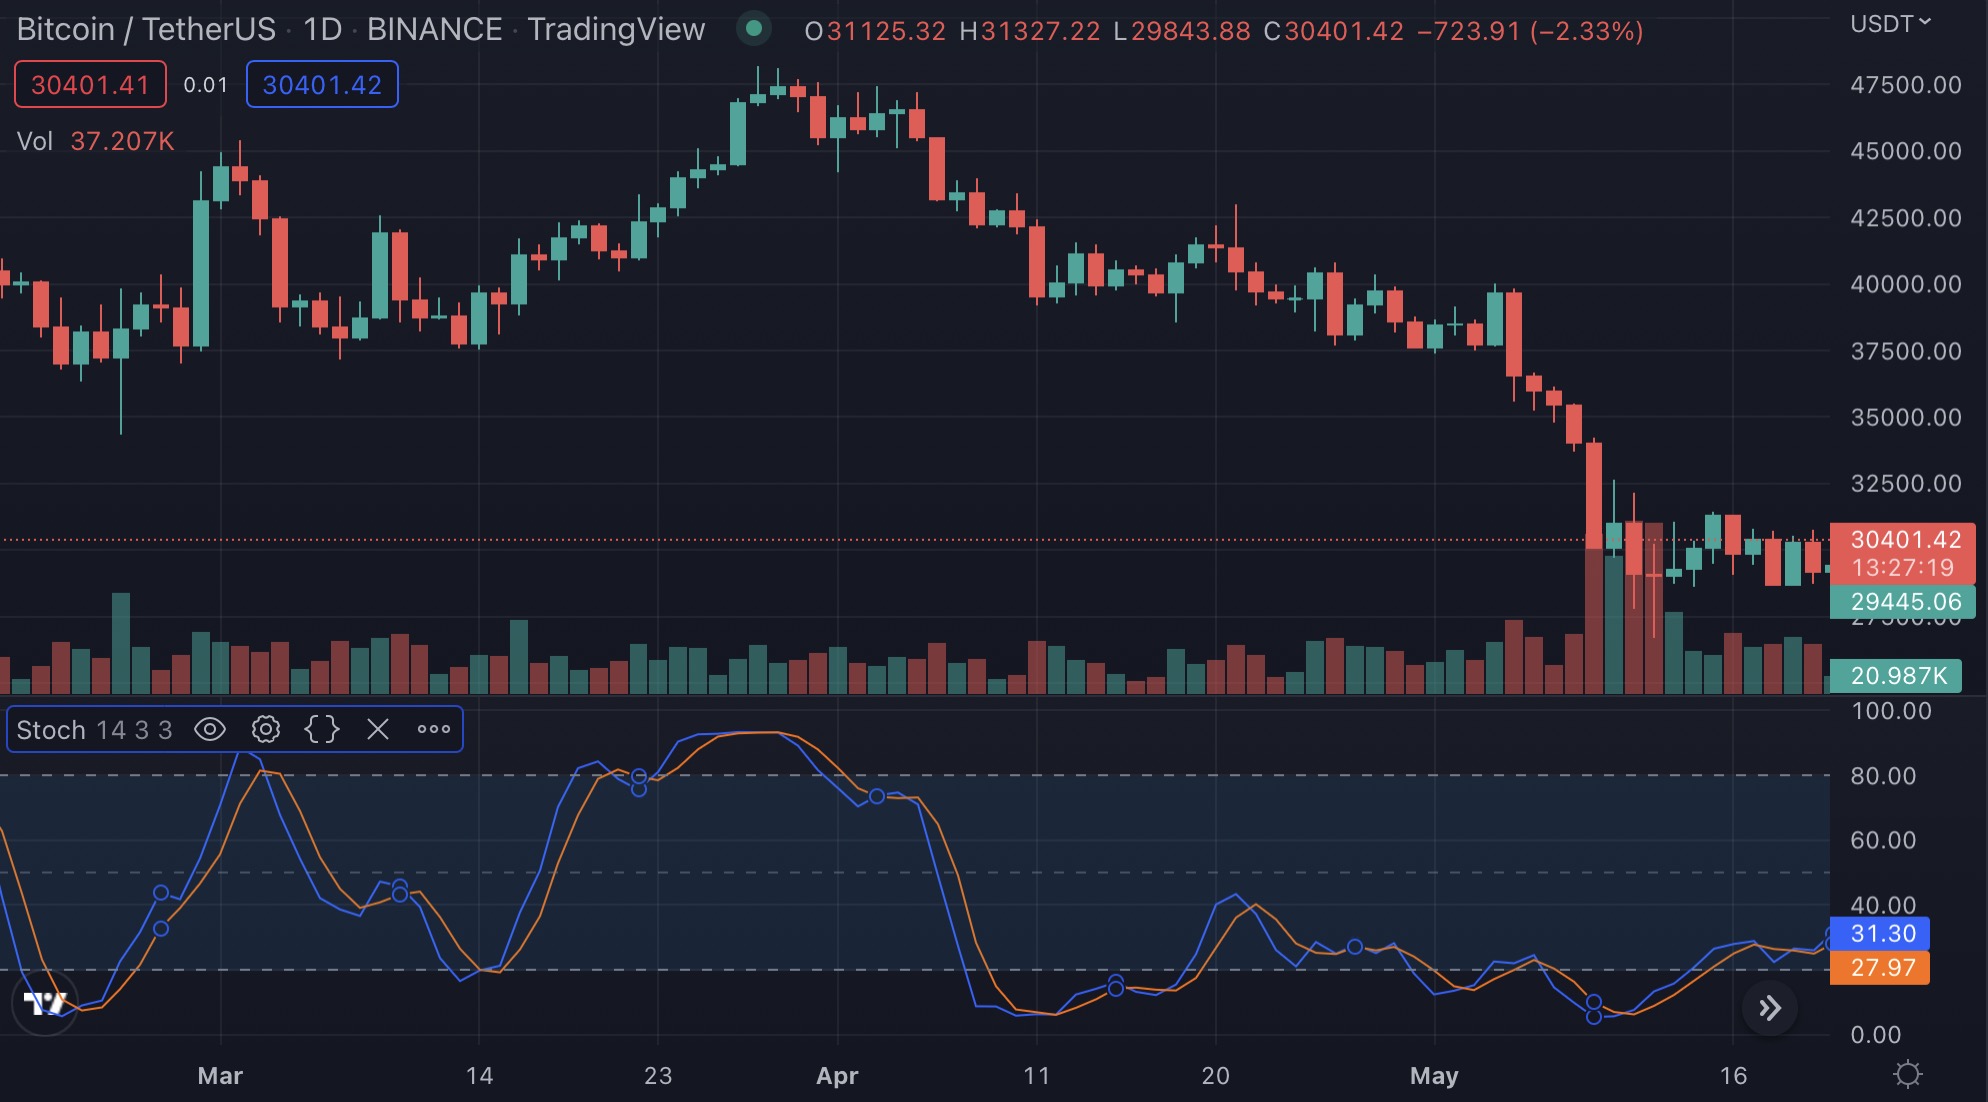
The standard fast stochastic settings tend to be 14.3.3. Again, we will break this down so that you can understand it more clearly.
- %K should be 14 days
- %K for slowing periods should be 3 days
- %D should be 3 days
- All of these should be simple moving averages, and the overbought and oversold ranges slightly differ. The overbought zone should be above 80, and the oversold zone should become below 20.
Take a look below and you can see a 4-hour chart with stochastic settings at 14.3.3.
Now that we have observed both fast and slow stochastic oscillators, it's time to look at the full stochastic!
Full Stochastic
The full stochastic oscillator, usually referred to as stochastic full, is essentially the generalized version of both the slow stochastic and fast stochastic oscillators. All three oscillators combine and are based on the fact that in an uptrending market, prices tend to close towards the top of the price range. In contrast, in a downtrending market, prices tend to close towards the bottom of the price range.
Fast Stochastic vs Slow Stochastic vs Full Stochastic
The differences between these three types of stochastic oscillators have already been mentioned, but let's summarize them briefly. The slow stochastic tends to be more accurate, is smoother, and drowns out "market noise." It takes in more data by using more moving average price data as well. The fast stochastic produces more "market noise," does not necessarily take into account the moving averages, and instead uses the most recent price data. This also results in more false signals. Lastly, is the stochastic full. This oscillator combines the two and tries to determine whether the market is uptrending or downtrending.
How to Pick the Best Stochastic Oscillator Strategy?
Now that we have discussed fast, slow, and full stochastic oscillators, let's look at different strategies based on these. We will look at four strategies in particular: stochastic divergence, stochastic crossover, stochastic overbought, and stochastic oversold. Each of these strategies can be beneficial to all traders if you know how to use them correctly and effectively. Let's jump into stochastic divergence first!
Stochastic Divergence
To be put simply, a divergence occurs when the indicator and price do not move hand in hand. Here are two examples. If the price reaches a new high and the stochastic fails to reach a new high, this is a sign of bearish divergence because it is signaling a potential weakness. In contrast, if a price reaches a new low and the stochastic does not make a new low, this is a sign of bullish divergence because there is a potential for strength.
When any divergence occurs, you should be on standby for the potential of a change in price direction. However, you should never trade on a divergence alone. Since divergence is not a timing indicator, some time may be necessary before a reversal occurs following a divergence. Below is an example of what a divergence looks like.
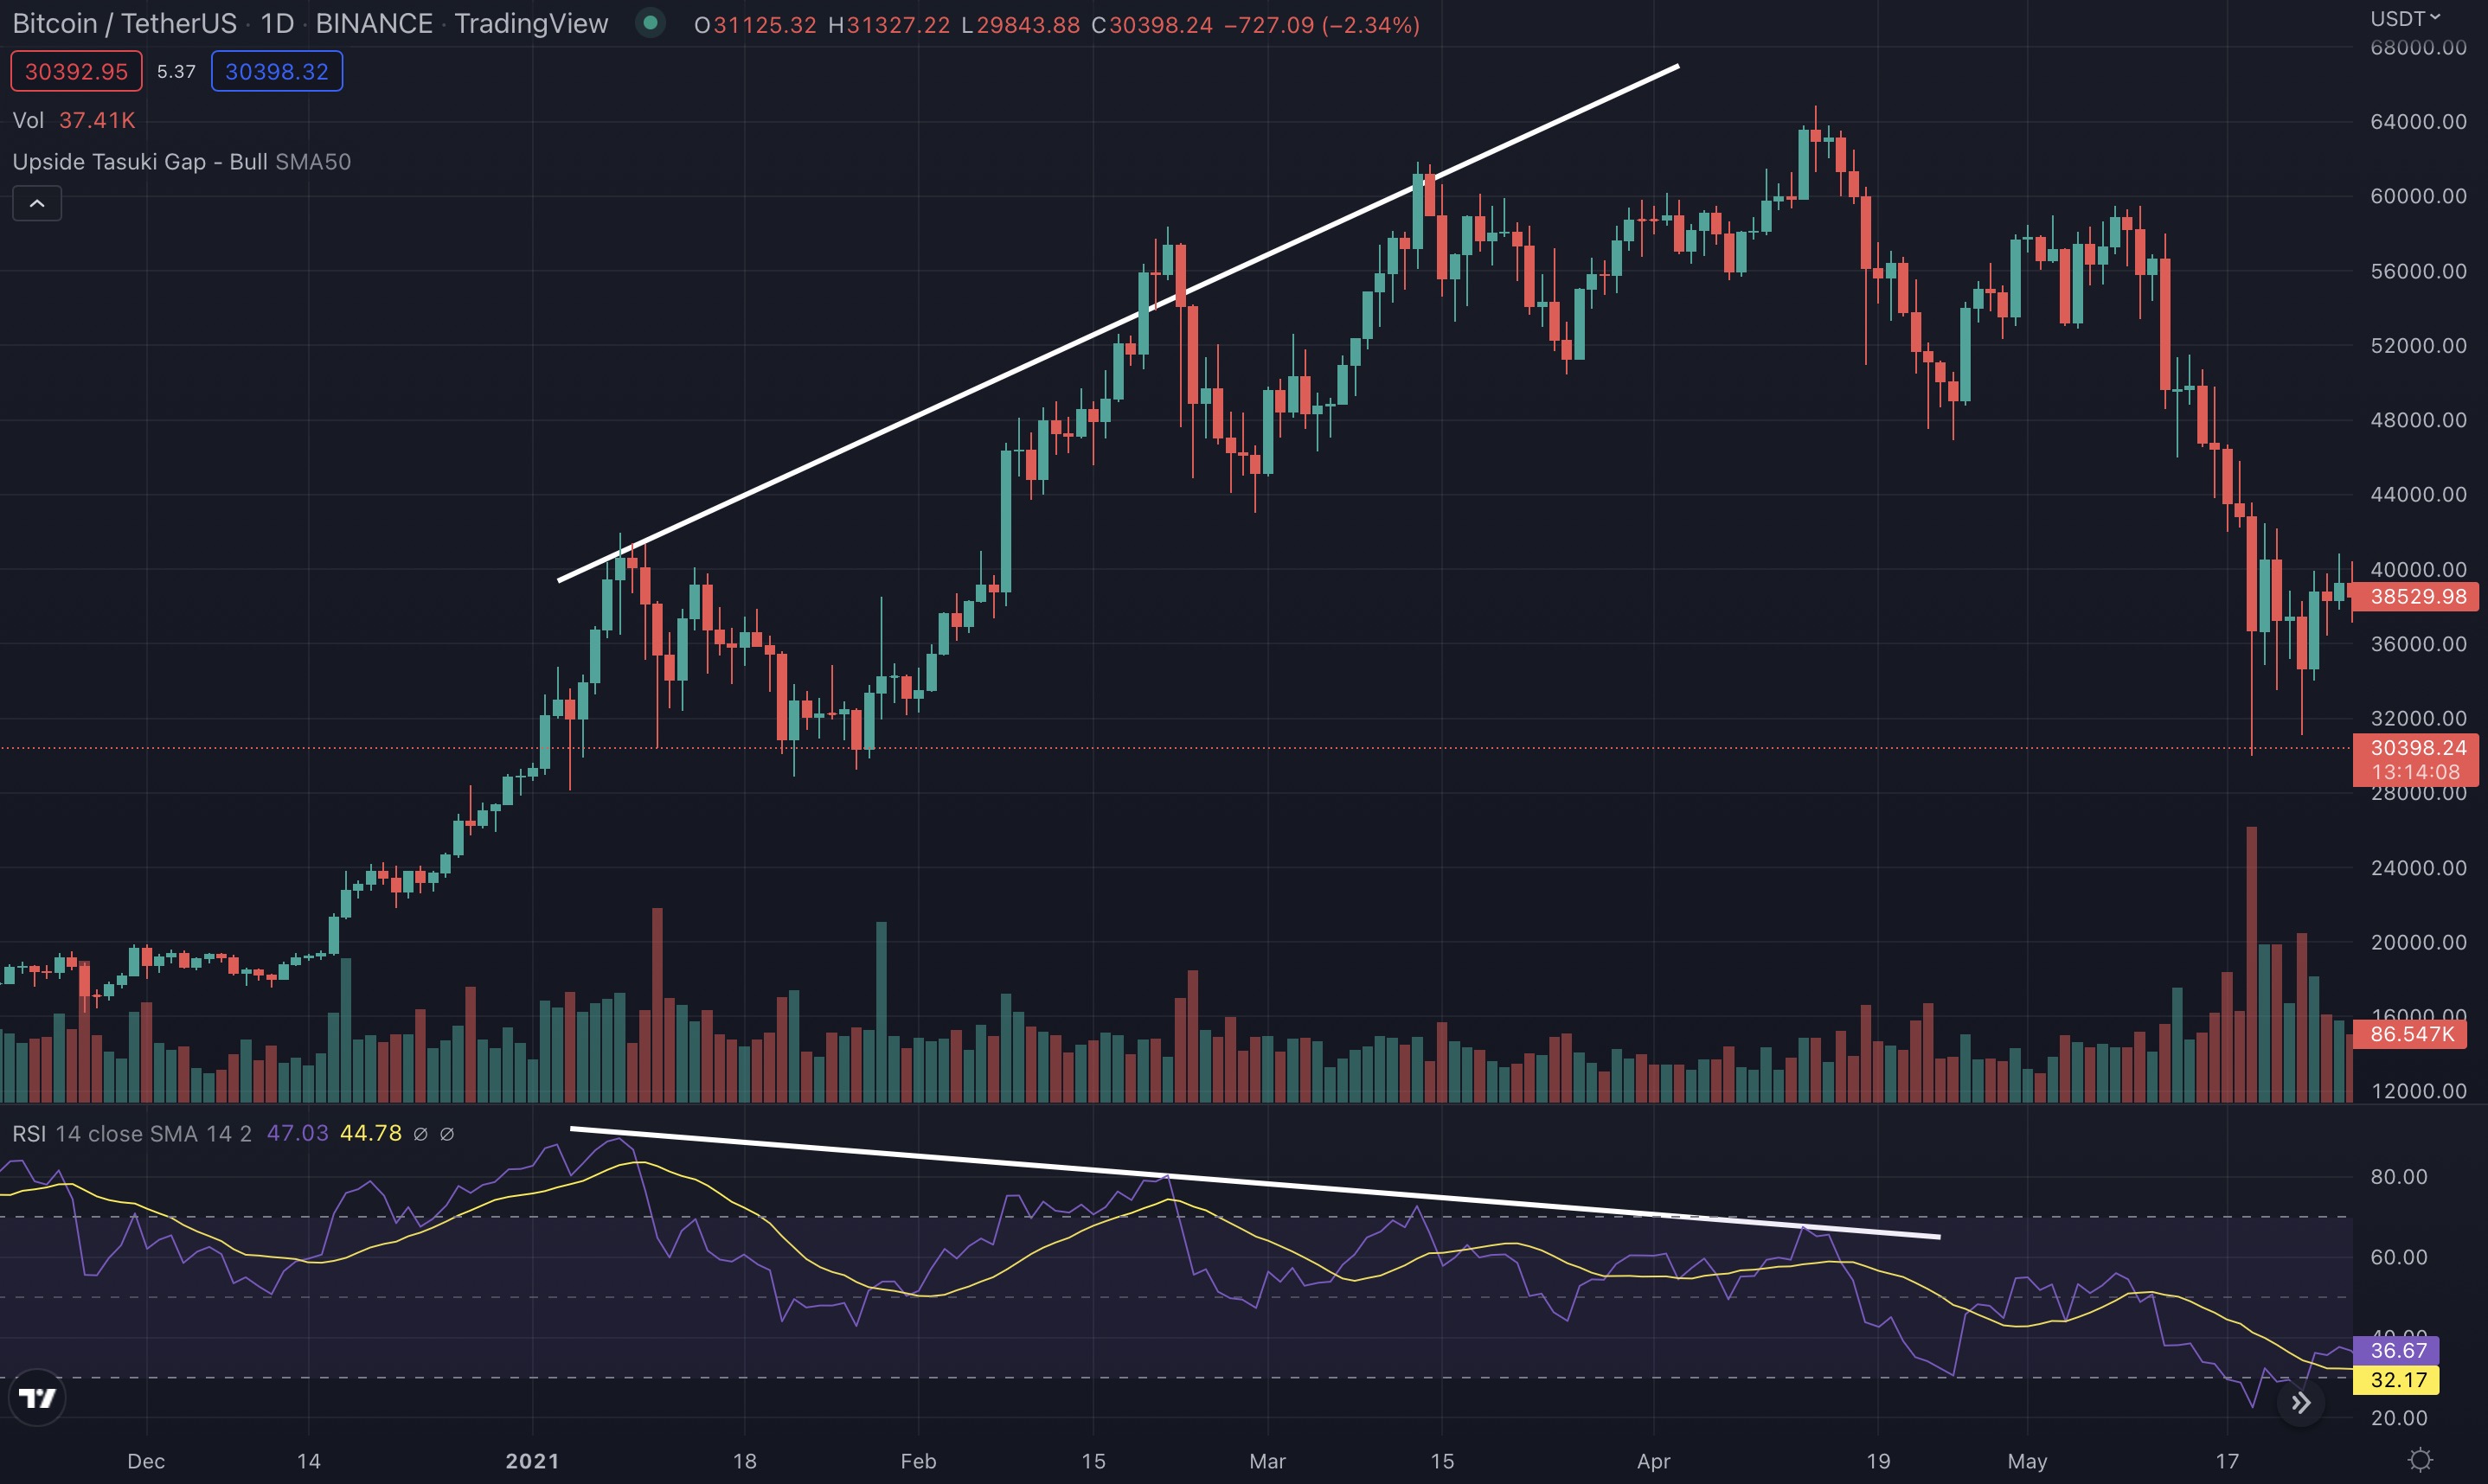
As a general rule, when you have a bearish divergence, you should wait for the price to break lower and see how the chart plays out before selling or going short. On the other side, if you have a bullish divergence, you should wait for the price to break higher before entry.
Now that we know what a stochastic divergence indicator is, we can look at the following three strategies. Since stochastic divergence is not a timing indicator and the following three are, these strategies can be combined when charting.
Stochastic Crossover
The stochastic crossover is an indicator that finds where either the stochastic slow or stochastic fast crosses the overbought or oversold zones, with overbought being over 80% and oversold being under 20%. To go into more detail, a crossover happens when the fast stochastic or %K line intersects the slow stochastic or %D line. Since the %K line tends to react more quickly to market and price changes, it oscillates at a fairly faster rate than the %D line does. Under the correct conditions, it is able to catch up to and cross over the %D line.
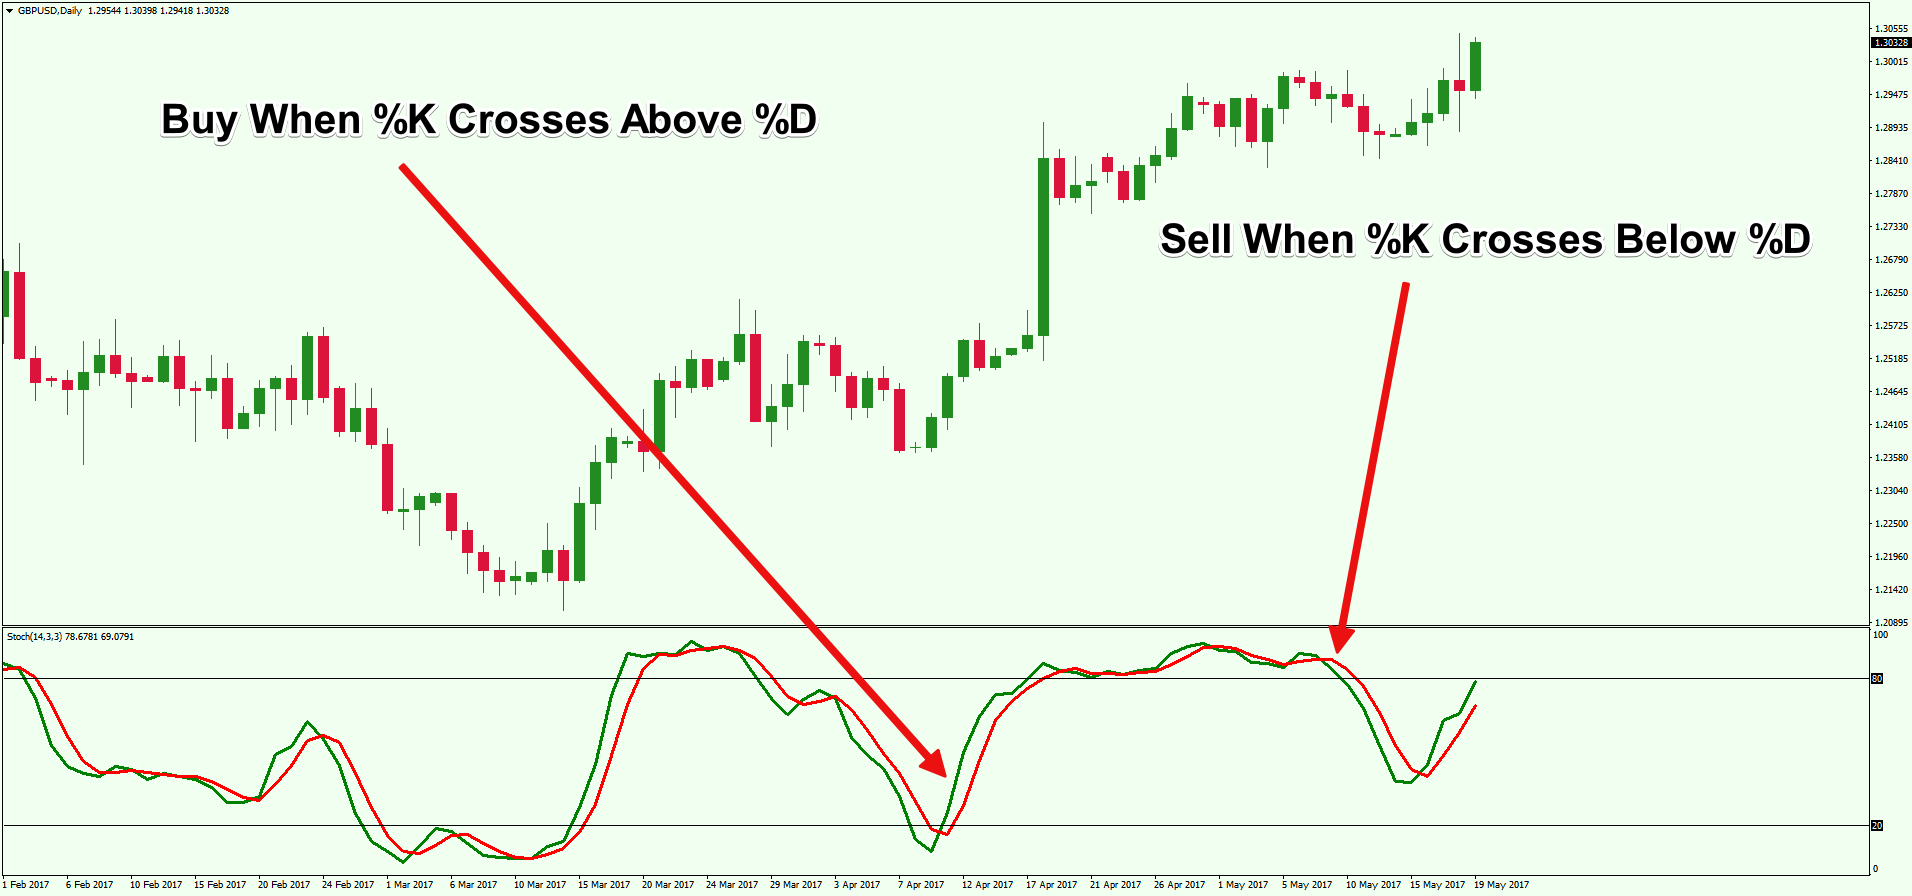
Stochastic crossover indicator can be used alongside stochastic divergence or as a stand-alone indicator. To keep things simple, the general rule is you should buy when the %K line goes above the %D line, and you should sell when the %K line dips below the %D line. Additionally, many traders like to pay attention to the 50-level crossover. This occurs when the %K stochastic decides to cross the 50 line on the range scale. This is generally seen as a movement towards a stronger position and may trigger a buy signal. Conversely, when the %K line dips below the 50 line, this shows a weakening position and may trigger a sell signal.
Let’s take a look at the chart below. This can help you to identify what a stochastic crossover looks like on a chart.
Now, let's look at stochastic overbought and oversold indicators!
Stochastic Oversold
In case you are still trying to get your head around all of this, the stochastic oscillator indicators are designed to show you an asset or cryptocurrency's momentum and whether they are being overbought or oversold, which all plays into the simplest part of economics, which is supply and demand. As previously mentioned, the oversold range is under 20% for fast stochastic and usually under 30% for slow stochastic. If the stoch shows that it is oversold, you should be looking for a place to buy when the indicator dips below 20%. If you want to wait for confirmation, then allow the stoch to get below 20%, and as it crosses back above or nears 20%, then that is your time for entry.
Stochastic Overbought
Now that we have simplified the main purpose of stochastic oscillators and already understand stochastically oversold, we will briefly address stochastically overbought. Again, as previously mentioned, the stoch overbought range is above 80% for fast stochastic and usually above 70% for slow stochastic. A sell signal becomes clear when the stochastic is above 80%. As with the oversold signal, if you want to wait for confirmation, wait for the stoch to be above 80%, and once it crosses below, place your sell orders.
Now we will move into the stochastic relative strength index or RSI!
What Is Stochastic RSI?
The stochastic RSI or stochRSI is another type of indicator that can be used in technical analysis. The stochRSI generally has a range between zero and one. This indicator is created by applying the stochastic oscillator formula to a set of relative strength index or RSI values instead of only using standard price data. When using RSI values, instead of price data, within the stochastic formula, traders can get an idea of whether the current RSI value is oversold or overbought.
The StochRSI oscillator was created to help traders take advantage of both momentum indicators in order to create a more sensitive indicator. This indicator is more knowledgeable about a specific asset's historical performance instead of simply a generalized analysis of price change.
Unlike the stochastic oscillator developed in the late 1950s by Lane, the stochRSI was developed by Stanley Kroll and Tushar S. Chande and first published in 1994. The pair developed this indicator to generate a greater number of signals than traditional indicators could and to improve sensitivity to market data.
Stochastic RSI Formula
The stochastic RSI formula is below. It is very similar to the stochastic oscillator formula that we observed earlier.
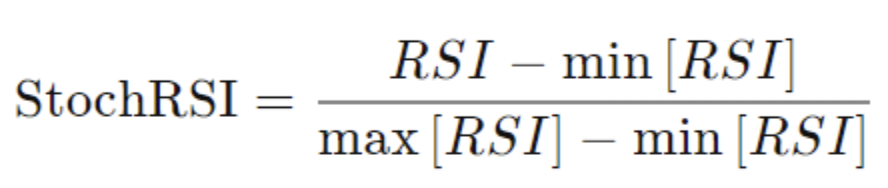
Using this formula, RSI refers to the current RSI reading. The min[RSI] refers to the lowest RSI reading over the past 14 periods. The max[RSI] represents the highest RSI reading over the past 14 periods. You must remember that the stochRSI is based on RSI readings. The RSI has an input value that is usually 14. This input value tells the indicator how many periods of data it is going to use in its calculation. These RSI levels are now used in the stochRSI formula.
Now, let's look at how to use the formula in a bit more simplified detail.
- Record the RSI levels for all 14 periods.
- In the 14th period, take note of the current RSI reading, the highest RSI reading, and the lowest RSI reading throughout the entire period. Now, it is possible to fill in all the variables for the stochRSI formula.
- In the 15th period, take note of the current RSI reading, the highest RSI reading, and the lowest RSI reading, but ONLY for the last 14 periods (NOT the last 15 periods). With this data, compute the new stochRSI.
- As each period ends, compute the new stochRSI value, but only use the last 14 RSI values.
How to Read Stochastic RSI?
Now that we know how to use the formula, we need to learn how to read the stochastic RSI. It is very similar to reading the results of the stochastic oscillator formula. The stochRSI is in the range when the value drops below 0.20. (Remember the 20% number from the stochastic oscillator.) This means the RSI value is trading towards the lower end of its predefined range.
Furthermore, the short-term direction of the underlying asset may be nearing a low, and a move higher is possible. On the other hand, if there is a reading above 0.80, the overbought range is being entered. (Remember the 80% number from the stochastic oscillator.) A reading over the 0.80 range usually suggests the stochRSI is reaching extreme highs and can be used to signal a pullback in the underlying asset.
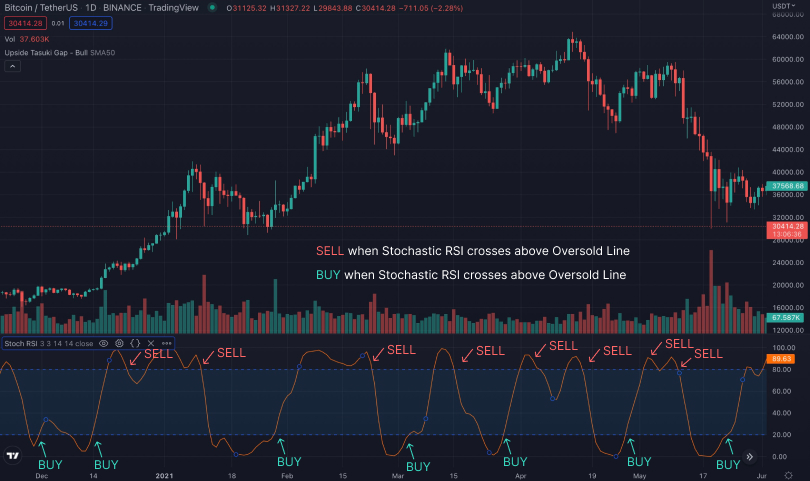
Let’s take a look at how to read Stochastic RSI on a chart, with both buy and sell signals.
Stochastic RSI Strategy
As we just learned above, using the stochastic RSI is very similar to using the stochastic oscillator. Even the numbers for overbought and oversold are the same, except the stochastic oscillator formula is based on 1-100 while stochRSI is based on 0-1. Traders can apply the same strategy for overbought and oversold using the stochRSI indicator to know when to enter and exit the market. Additionally, the 50-level crossover strategy applies similarly to the .50 line using the stochRSI! The one major difference is the stochastic RSI indicator is more sensitive to market data and can usually be considered to be more accurate!
Finally, let's quickly look at how stochRSI and RSI differ.
RSI vs Stochastic RSI
RSI and stochRSI seem similar to most new traders. However, the stochastic RSI uses a different formula from what gives us RSI values. RSI is simply a derivative of price. On the other hand, stochRSI is a derivative of RSI itself or a second derivative of price. One of the main differences between the two is how quickly the indicators move. Stochastic RSI moves very rapidly from the overbought to oversold zones or vice versa. Conversely, the RSI is a much slower-moving indicator. One isn't necessarily better than the other. It's as simple as the stochRSI moves much faster than the RSI.
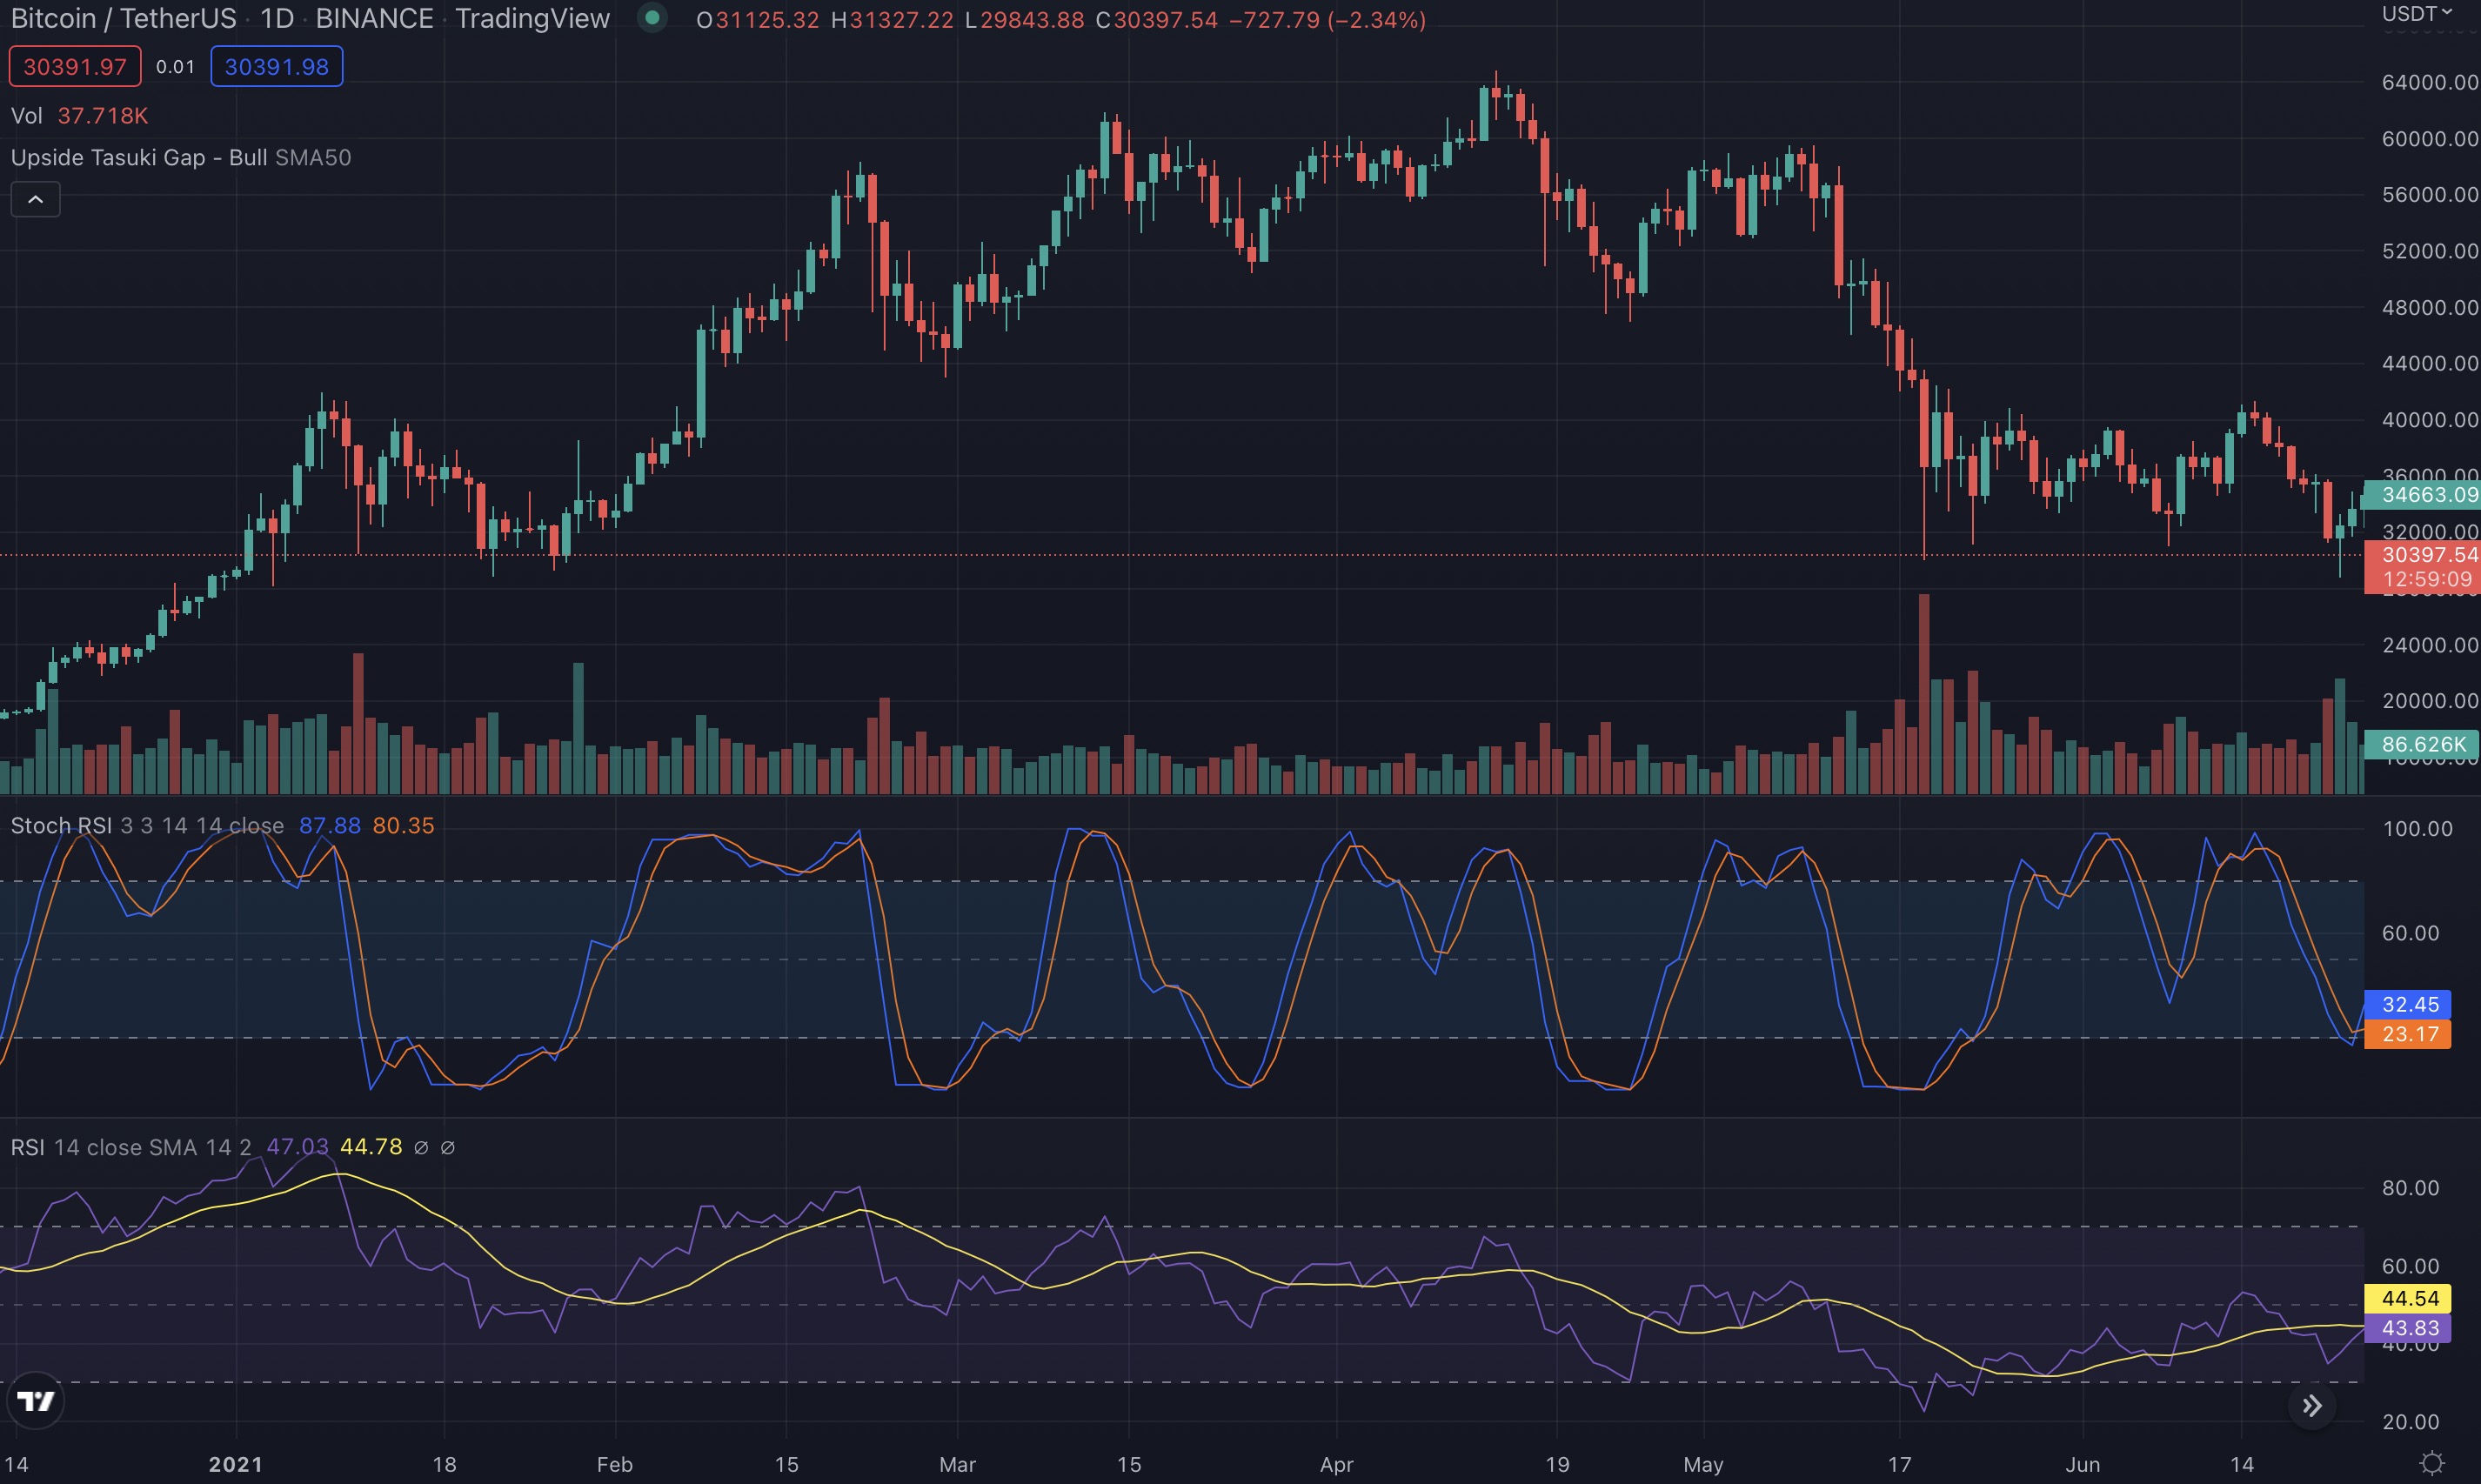
Take a look at the chart below and you can see the comparison of Stochastic RSI vs RSI at the bottom of the AVAXUSDT chart.
Conclusion
Now that we have covered all the different aspects of the stochastic oscillator, different strategies, stochastic RSI, and how it differs from RSI, you should be able to go test these new tools of the trade on TradingView. After you have put your new skills to practice and mastered the charts it’s time to apply them in real life. Once you are ready for that, hop on over to bitoftrade and start turning your practice into profits!