What is swing trading crypto?
Swing trading crypto is a type of cryptocurrency trading that involves speculating on the price of cryptocurrencies on weekly timeframes. Swing traders try to predict the future price movements of their chosen cryptocurrency and take advantage of these predictions by buying and selling accordingly. Swing trading can be done on both spot and derivatives exchanges.
In fact, many people believe that it is the only way to make money from cryptocurrency. As a result, most of the people who trade crypto for a living.
Swing Trade vs Day Trade - What’s the Difference?
The two most common types of cryptocurrency trading are swing trading and day trading. So, what’s the difference?
Swing trading involves taking a position and holding it for an extended period of time, usually a few days or weeks. Swing traders often use technical analysis for the prediction of future price movement.
Day trading, on the other hand, involves opening and closing positions multiple times within the same day. Usually, this approach means making small profits multiple times. Day traders are generally looking to take advantage of short-term price movements.
So, when comparing swing trading vs day trading, which is better? There is no easy answer to this question. Swing trading and day trading both have their own advantages and disadvantages.
Swing trading crypto has a few key advantages over day trading:
You don’t need to be glued to your computer screen all day. Swing traders can have full-time jobs or other commitments outside of trading. Swing trading generally has a lower risk profile than day trading. This is because you are not exposed to the market for as long. In swing trading, you make fewer trades to implement your strategy, which reduces the risks to human factors and overall failure probability.
Swing trading can be more profitable than day trading. This is because you are giving your trades time to develop and reach their full potential. As a result, one successfully closed swing trade position can cover a few failed ones.
Swing traders tend to have a better understanding of the market and their chosen cryptocurrencies. This gives them an edge over day traders who are often just trying to make a quick profit.
On the other hand, day trading has a few advantages over swing trading:
Day traders don’t have to wait for their trades to develop. This means they can take advantage of short-term price movements more easily.
Day trading is generally less risky than swing trading. This is because you are only exposed to the market for a short period of time.
Day trading can be more profitable than swing trading in a short-term perspective. This is because you have the potential to make more trades in a shorter period of time.
So, which is better - day trading vs swing trading?
The answer is the following. It depends on your goals, trading toolset, risk tolerance, and your understanding of the market. If you’re new to cryptocurrency trading, then you should probably start with swing trading. Swing trading is a good way to get your feet wet and learn about the market without putting your capital at risk.
If you’re an experienced trader, you can choose swing trading or day trading. It really depends on your personal preferences.
How Does Swing Trading Cryptocurrency Work?
Cryptocurrency swing trading is a type of trading that involves holding a position for an extended period of time and taking advantage of price swings.
The key to swing trading is to find a cryptocurrency that is volatile and has a lot of price swings. Bitcoin, Ethereum, Litecoin, and Ripple are good examples of cryptocurrencies suitable for swing trading. Also, the majority of altcoins are perfect assets for swing trading on the weekly and monthly timeframe as their price follows Bitcoin’s trend with a kind of multiplication.
When swing trading, you will generally hold a position for a few days or weeks. You will then try to predict future price movements using technical analysis.
Definitely, you should also use stop-loss orders to limit your losses. A stop-loss order is an order that automatically sells your position if the price falls below a certain level.
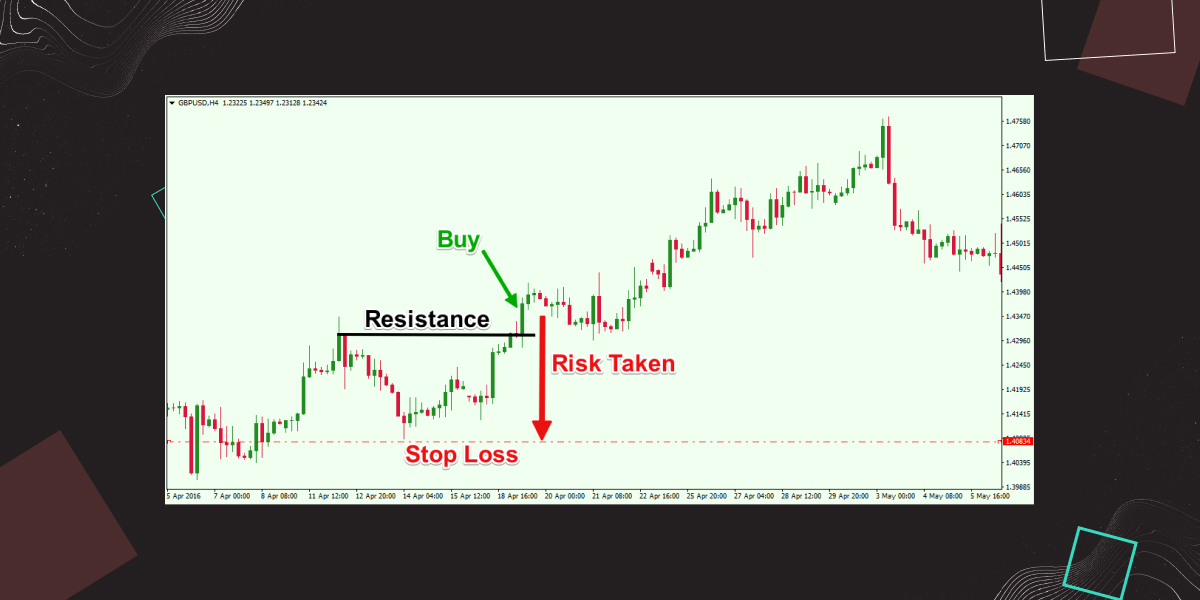
- For example, let’s say you buy 1 BTC at $10,000 and set a stop-loss order at $9,500.If the price of BTC falls to $9,500, your stop-loss order will be triggered and your position will be automatically sold. Swing trading is a great way to profit from cryptocurrency price swings. However, it’s important to remember that swing trading is a speculative activity and you should always do your own research before investing.
- If the price falls to $9,500, then your stop-loss order will automatically sell your position.
- You should always do your own research before investing in any cryptocurrency. Swing trading is a great way to speculate on the price swings of cryptocurrencies. The key is to find an altcoin or Bitcoin that is volatile and has a lot of price swings. When swing trading, you will generally hold a position for a few days or weeks.
- This will help you limit your losses if the price goes against you.
- It works vice versa with Taking Profit order, which is also a vital tool of a swing trader.
Adding up to that they follow the rule of thumb for trading which is to buy low and sell high.
How to Get Started With Crypto Swing Trading?
If you want to start swing trading cryptocurrency, then there are a few things you need to do first.
- Firstly, you need to choose a good cryptocurrency exchange. You may choose between CEX or DEX. Even if prefer to use CEX features and stay anonymous or just keep your money in your own wallet bitoftrade will be the best choice.
- Secondly, you need to choose a good charting software. TradingView is a popular option.
- Thirdly, swing trading cryptocurrency goes hand in hand with technical analysis. The majority of trading ideas in swing trading are formed by means of chart patterns and tech indicators analysis. So, you have to find a good trading setup before moving on. There are many resources available online that can help you with this.
- Comly with money management rules. What is your position size? Make sure you do not risk more than 1% of your portfolio when the trade goes bad. To clarify: if you have $1000 to trade with, you should never risk $100 or more on a single trade! You only want to risk $10 which is 1%, or less on any given trade or position.
- Follow risk management rules. The risk reward ratio, also written as R: R, is a way to measure your potential loss compared to your potential win. If you risk 1 dollar, and you can potentially earn 3, then your R: R is 1:3.
- Lastly, you need to start practicing with a low amount of money. This will allow you to get familiar with the market before putting your capital at risk.
These are just a few things you need to do if you want to swing trade crypto. These steps will help you get started on the right foot.
However, to completely fit in the market you should learn what other swing traders do. This will give you a better image and also some tips about what to do.
Crypto Swing Trading Strategies That Actually Work
To predict future price fluctuations, swing traders use various indicators and swing trading chart patterns. Here are some infamous examples:
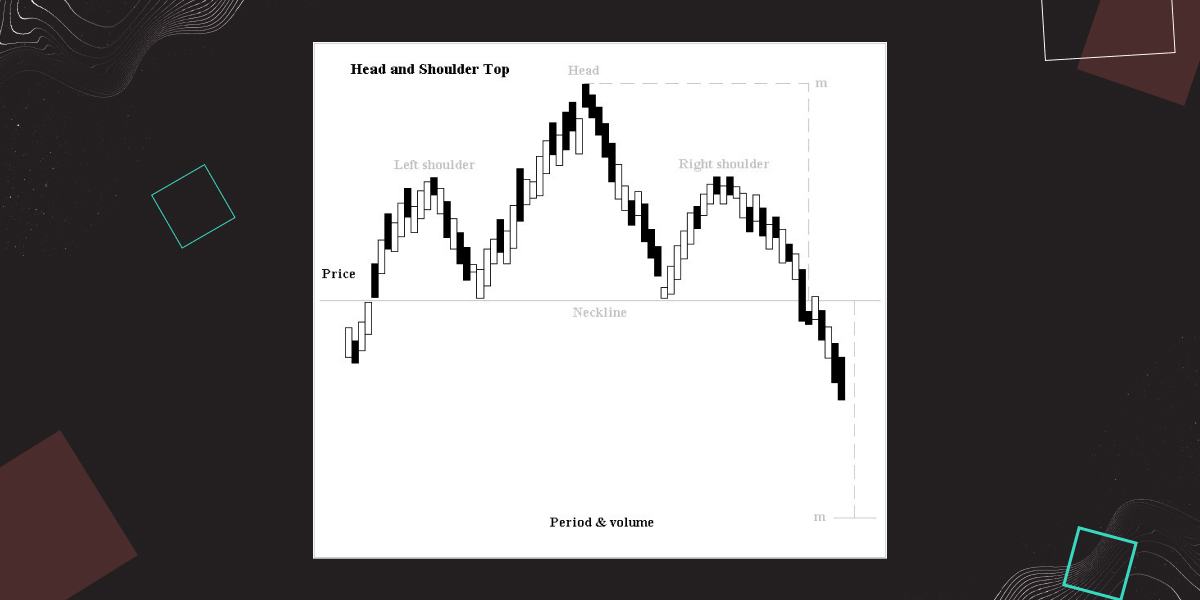
The Head and Shoulders Pattern
The head and shoulders pattern is traditionally considered a bearish signal, as it indicates that the market is losing steam and is likely to reverse course. However, it is essential to note that this pattern can also form in a bullish trend, in which case it would be considered a bullish signal.
To confirm the head and shoulders pattern, traders typically wait for the market to break below the neckline. The neckline is formed by connecting the lows of the left shoulder and the head. The break below the neckline is considered to be a bearish signal, as it indicates that the market has finally reversed course and is headed lower.
There are a few things to keep in mind when trading the head and shoulders pattern. First, it is important to wait for the pattern to confirm by waiting for the break below the neckline. Second, the pattern is more reliable if the left shoulder and the head are roughly equal in height. Finally, the pattern is more reliable if the right shoulder is lower than the left shoulder.
The head and shoulders pattern is a useful tool for predicting market reversals. However, it is important to remember that no pattern is perfect, and the head and shoulders pattern is no exception. As with any other technical indicator, it is important to use the head and shoulders pattern in conjunction with other indicators in order to make more accurate predictions.
This chart pattern is used to predict a trend reversal in a certain market.
The Cup and Handle Pattern
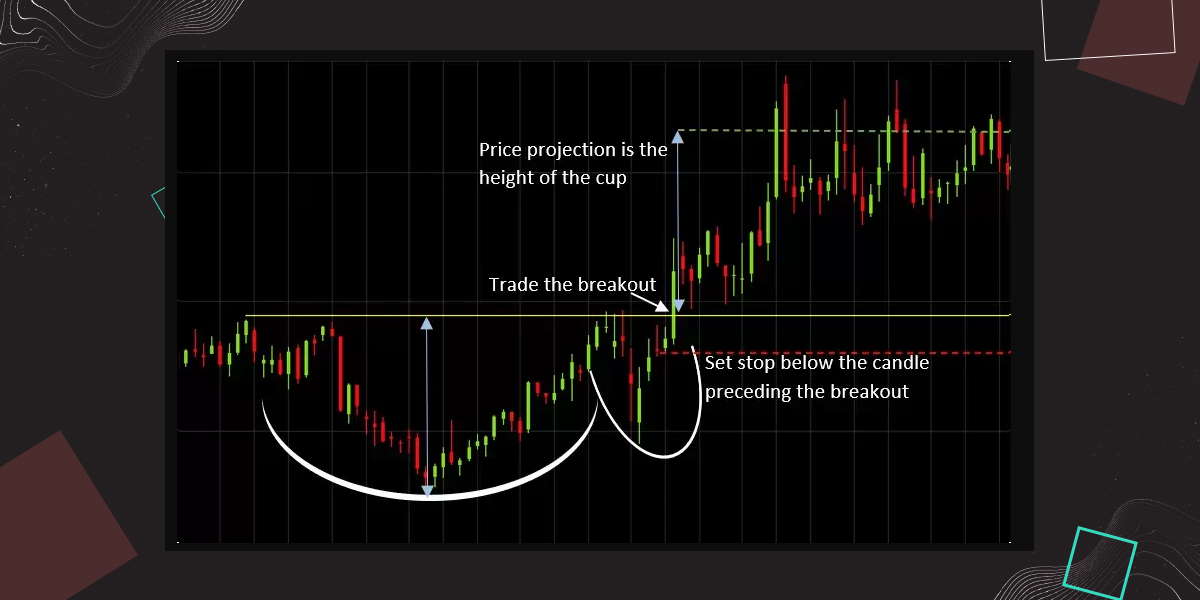
This chart pattern predicts a continuation of the current price trend.
The Double Bottom Pattern
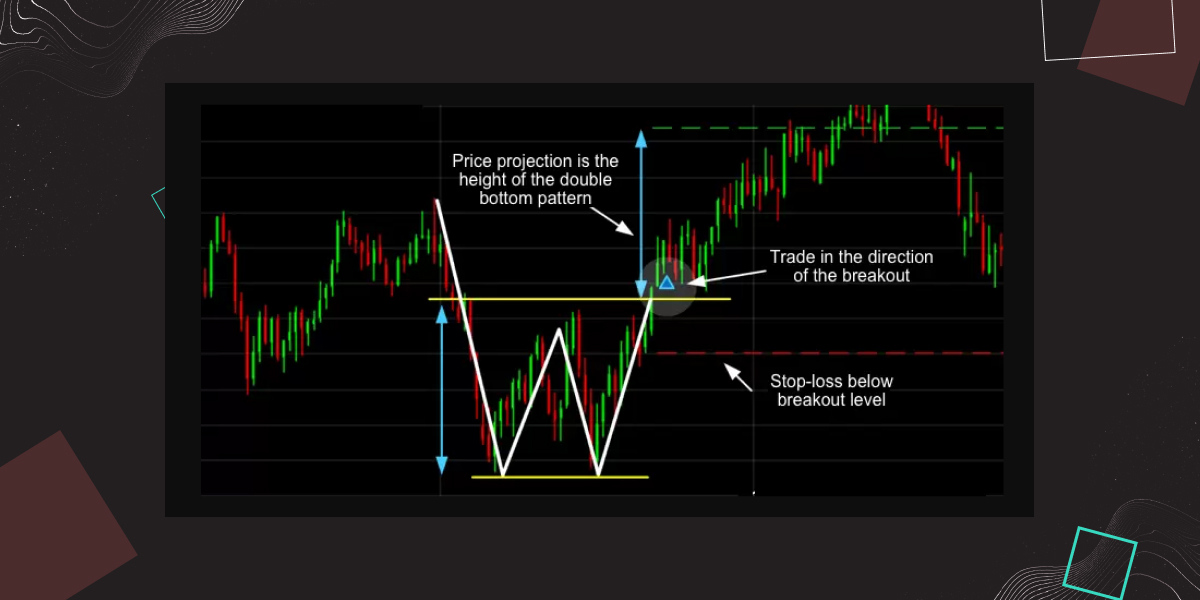
The double bottom pattern is a bullish reversal pattern that forms after a prolonged downtrend. The pattern is created when the price action tests the same support level twice and is followed by a breakout above resistance. The first test of support creates a "bottom" while the second test confirms the level of support. The breakout above resistance signals that the downtrend has reversed and that buyers are now in control.
This chart pattern is used to predict a reversal in the market.
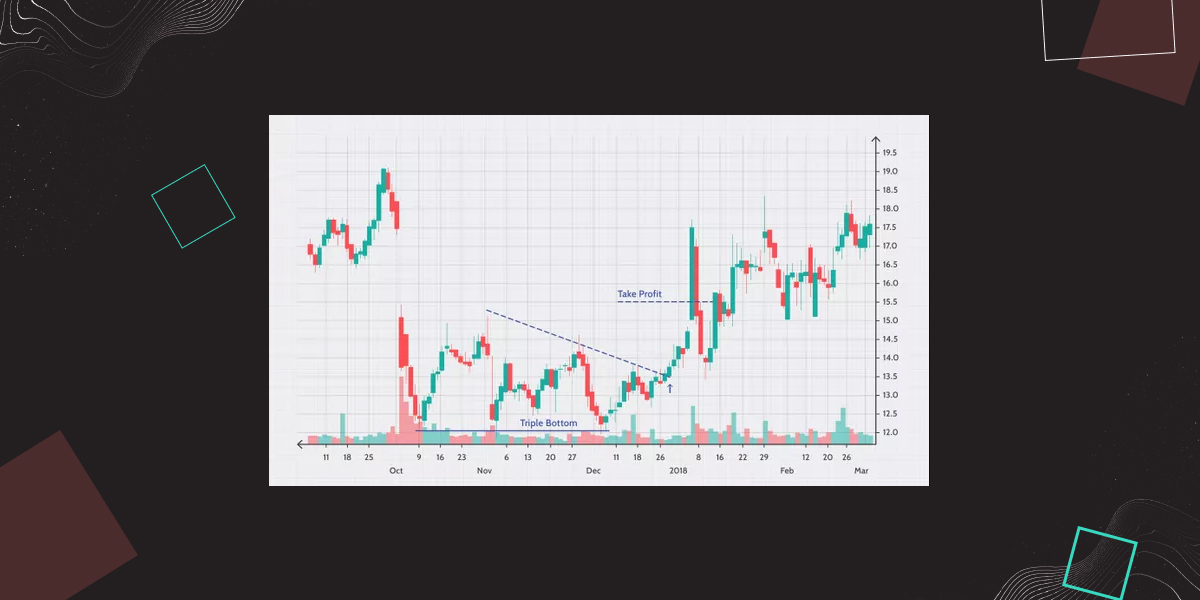
The Triple Bottom Pattern
The triple bottom pattern is a bullish reversal chart pattern that is used to identify market bottoms. The pattern is created when prices hit a low three times in a row, with each low being higher than the last.
The triple bottom pattern signals that the market has found support at this level and is likely to move higher. This makes it a bullish pattern that can be used to enter long positions. The stop-loss for this trade should be placed below the lows of the pattern. The target for this trade should be based on previous support and resistance levels.
This chart pattern is used to predict a continuation of the current trend.
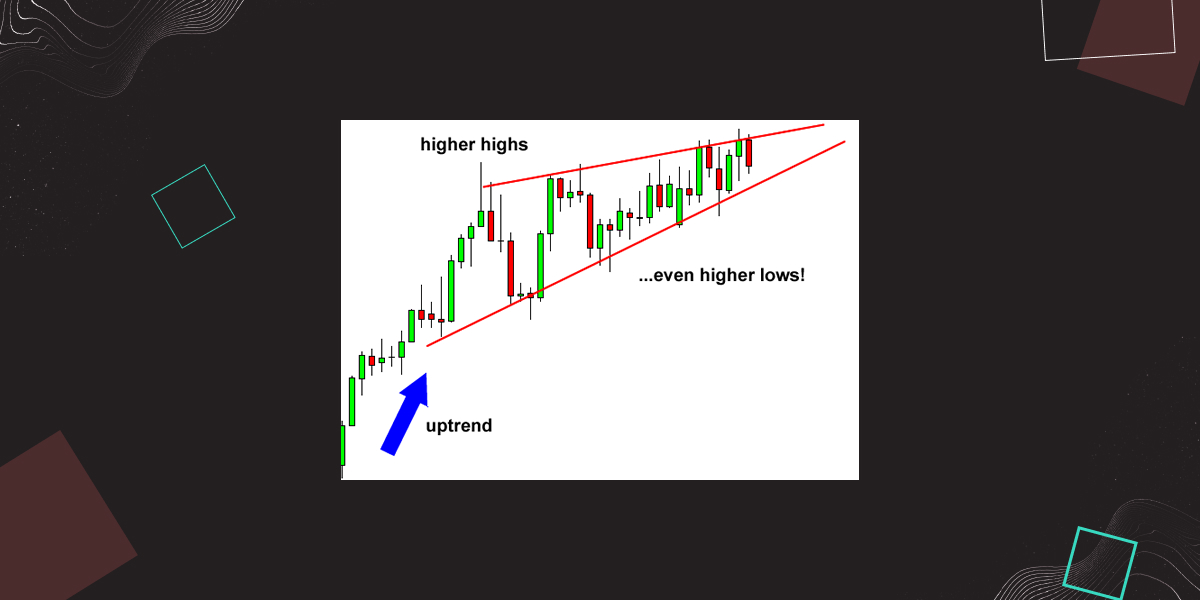
The Rising Wedge Pattern
The rising wedge pattern is a bearish reversal pattern that can be found in an up-trending market. The pattern is created by a series of higher highs and higher lows that converge towards each other, creating a wedged shape on the price chart.
The key to identifying this pattern is to look for a sharp decline from the highs of the wedge, which signals that the bulls are losing control and the bears are taking over. This pattern can be found in any time frame but is most commonly seen on shorter-term charts.
When this pattern forms, it is a sign that the market is getting ready to reverse course and head lower. The best way to trade this pattern is to wait for a breakout below the lows of the wedge, which can be used as a trigger to enter a short position.
This chart pattern is used to predict a reversal in the market.
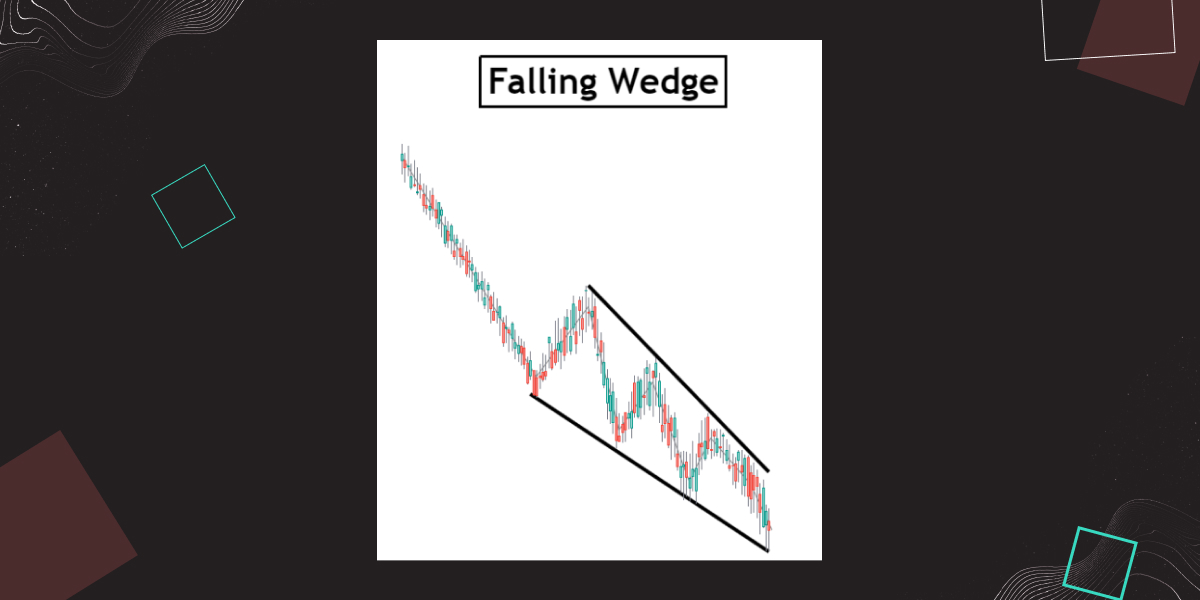
The Falling Wedge Pattern
The falling wedge pattern is a bullish reversal pattern that can be found in both uptrends and downtrends. The pattern is created by drawing two trendlines that connect a series of lower highs and lower lows. The pattern is considered bullish because it typically forms during a downtrend and signals that the selling pressure is weakening.
This chart pattern is used to predict a continuation of the current trend.
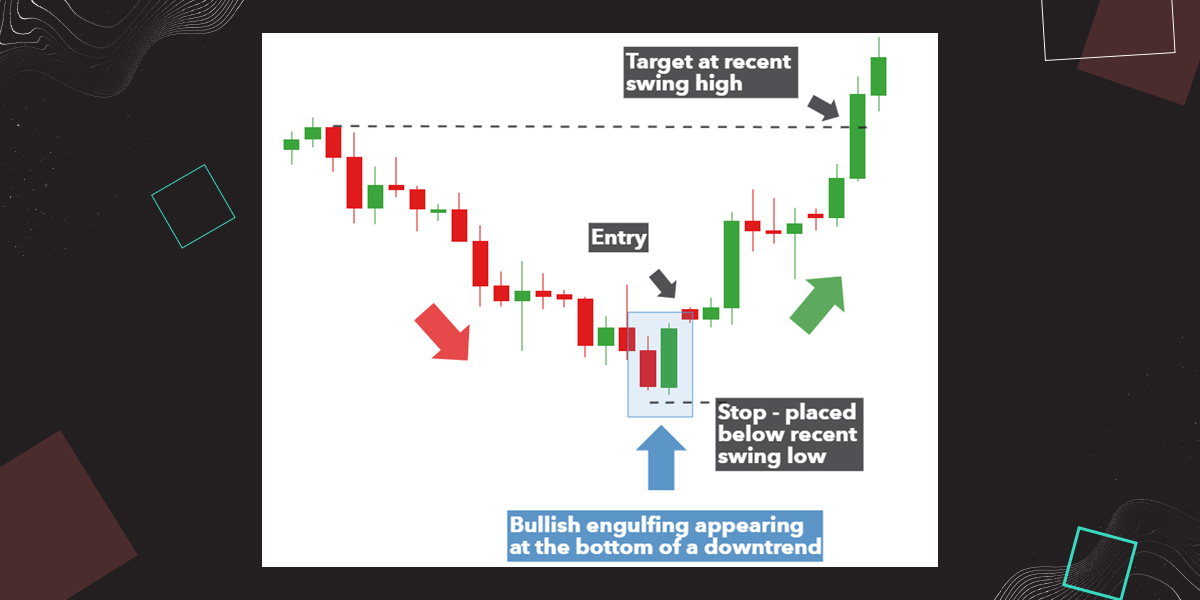
The bullish engulfing pattern
The bullish engulfing pattern is a two-candlestick reversal pattern that is used to signal the end of a downtrend. The pattern is made up of a small red candlestick followed by a large green candlestick. The red candlestick should be located within the body of the previous green candlestick, and the green candlestick should completely engulf the red candlestick. The bullish engulfing pattern is considered a reliable reversal indicator, and it is often used by traders to enter into long positions.
This chart pattern is used to predict a reversal in the market.
The bearish engulfing pattern
The bearish engulfing pattern is a two-candlestick pattern that signals the potential for a reversal to the downside. The pattern is made up of a small white candlestick followed by a large black candlestick that completely engulfs the body of the first candlestick. The bearish engulfing pattern can be found at the end of an uptrend or during a consolidation period. It indicates that the bears are in control and that the momentum is shifting to the downside.
This chart pattern is used to predict a continuation of the current trend.
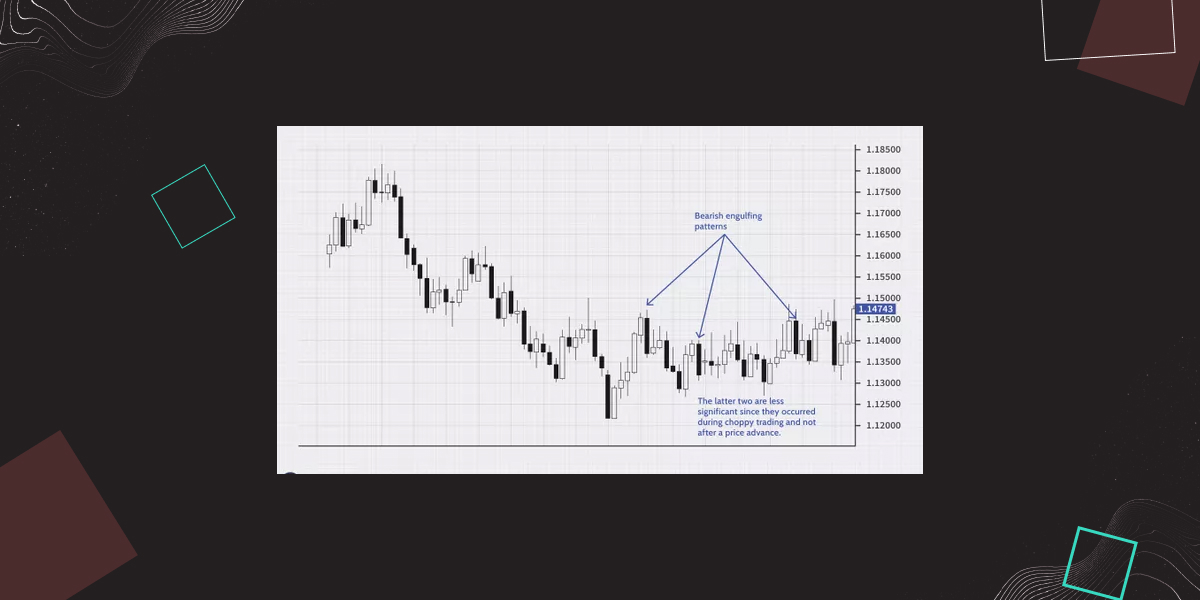
If you want to learn more about bullish patterns, follow this link.
In addition, swing trading cryptocurrency is mostly performed with an analysis based on technical indicators like Moving Averages, Bollinger Bands, Fibonacci Retracements, and Relative Strength Index (RSI).
Best Moving Average for Swing Trading
There are many moving averages that can be used for swing trading. However, the most common ones are
the 20-period moving average is used to identify the short-term trend
the 50-period moving average is used to identify the medium-term trend.
the 200-period moving average. is used to identify the long-term trend.
When swing trading, you should always trade in the direction of the trend. And you can use moving averages to identify it. If the price is above the 20-period moving average, then the short-term trend is up. If the price is above the 50-period moving average, then the medium-term trend is up. And if the price is above the 200-period moving average, then the long-term trend is up.
On the other hand, if the price is below the 20-period moving average, then the short-term trend is down. If the price is below the 50-period moving average, then the medium-term trend is down. And if the price is below the 200-period moving average, then the long-term trend is down.
Support And Resistance Swing Strategy
There are a few ways to detect support and resistance on the chart.
The first way is to use trendlines. A trendline is a line that connects two or more price points on the chart. When the price is going up, you can draw a line that connects the lows on the chart. This line is called an uptrend line. On the other hand, when the price is going down, you can draw a line that connects the highs on the chart. This line is called a downtrend line.
The second way to detect support and resistance is to use moving averages. A moving average is a line that shows the average price of the security over a period of time. The most common moving averages are the 50-day moving average and the 200-day moving average. When the price is above the moving average, it is considered to be in an uptrend. On the other hand, when the price is below the moving average, it is considered to be in a downtrend.
The third way to detect support and resistance is to use Fibonacci levels. Fibonacci levels are based on a mathematical sequence that was discovered by an Italian mathematician named Leonardo Fibonacci. The most important Fibonacci levels are the 38.2%, 50%, and 61.8% levels. When the price is approaching a Fibonacci level, it is considered to be potential support or resistance level.
The fourth way to detect support and resistance is to use price action. Price action is the movement of the price on the chart.
This strategy looks for price action at or near areas of support and resistance. These are key levels where the bulls and bears are battling for control of price. By looking for candlestick patterns at these key levels, we can get an idea of which side is winning the battle.
If the market is trading near a support level and we see a bullish candlestick pattern, this is a sign that the bulls are in control and that prices are likely to continue higher.
Conversely, if the market is trading near a resistance level and we see a bearish candlestick pattern, this is a sign that the bears are in control and that prices are likely to continue lower.
This swing trading strategy can be used in any time frame from the 1-minute chart up to the monthly chart. However, the shorter the time frame, the more false signals there will be. This is why it’s best to use this strategy in the daily or weekly time frame.
There are many different candlesticks that can be used for this strategy, but some of the most common are the hammer, inverted hammer, shooting star, and engulfing patterns.
Bollinger Bands Swing Strategy
Bollinger Bands are one of the most popular technical indicators used by traders. The Bollinger Band consists of an upper band, a lower band, and a simple moving average (SMA). The upper and lower bands are typically 2 standard deviations away from the SMA.
The Bollinger Bands Swing Strategy is a simple trading strategy that is designed to take advantage of the natural swing of the market. The strategy looks for trading opportunities when the market is consolidating within the Bollinger Bands.
The key to this strategy is to wait for a breakout from the Bollinger Bands and then enter the trade in the direction of the breakout. The stop loss can be placed at the opposite band.
The target for this trade can be either the next support or resistance level, or a trailing stop can be used to lock in profits. This is a simple strategy that can be used in any timeframe from the 1-minute chart up to the monthly chart.
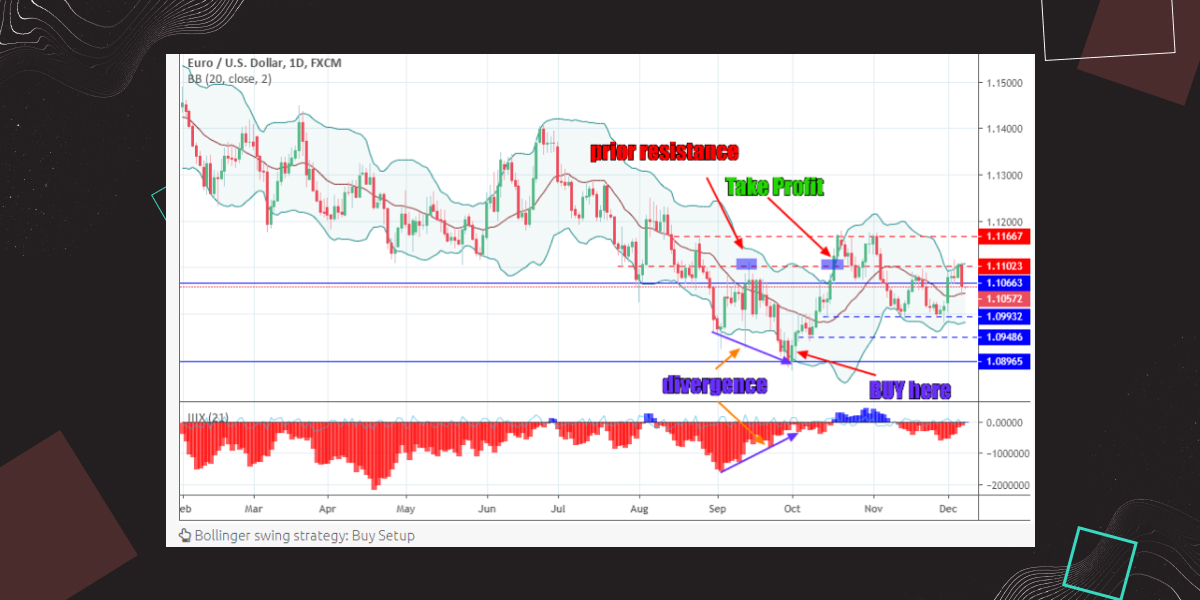 Indicating buy
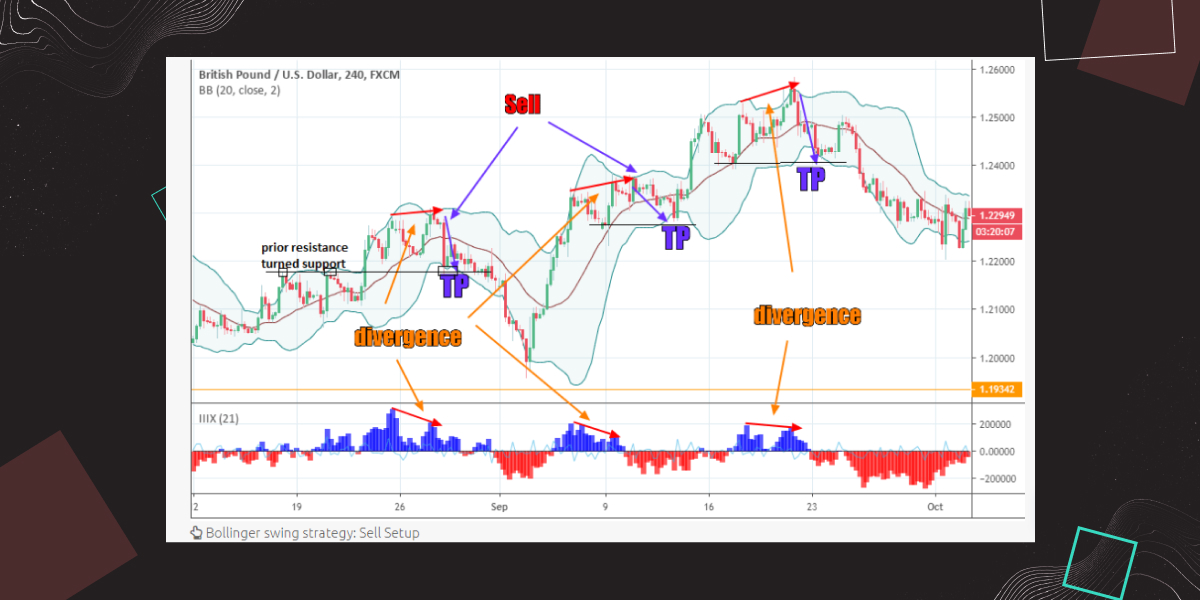 Indicating sell
What Is the Best Crypto to Swing Trade?
The best crypto to swing trade is the one that is trending. Trending cryptocurrency is more likely to continue moving in the same direction. And this makes it easier to profit from.
Some of the best cryptocurrencies to swing trade are Bitcoin, Ethereum, DOT, KSM, CRV, and UNI. These are all coins that have been trending over the past few months. And they are all coins that have a lot of liquidity. This means that they are easy to buy and sell.
Is Swing Trading Profitable?
Swing trading is a very profitable way to trade cryptocurrency. And it's also a great way to kickstart the crypto market.
However, holding a swing position is not for everyone. You need to have a solid understanding of technical analysis and be able to identify trends. Also, you need to be patient and disciplined. But if you can do all of that, then swing trading is a great way to make money in the crypto market.
In addition, many swing traders are making a full-time income from trading cryptocurrency. So, if you're looking to make some serious money in the crypto market, then swing trading is the way to go. To increase your gains, try to swing trade using leverage on bitoftrade.
Swing trading is a great way to trade cryptocurrency because it allows you to profit from both the up and down swings in the market during a prolonged period of time. And it's a great way for beginners to get started in the market because it's relatively easy to understand and implement.
How to Start Swing Trading for a Living?
You must first have a good understanding of technical analysis and the ability to spot trends if you want to swing trade for a profession. You must also be patient and hardworking.
In addition, you need to have a solid risk management strategy and understand money management. This means that you need to know what is the appropriate size for a certain position, when to take profits and how to cut your losses.
And, you need to have a solid swing trading strategy. This means that you need to identify how to set up your position, when to buy, and when to sell, based on technical and chart patterns analysis
If you can do all of those things, then swing trading is a great way to make money in the crypto market.
How to Swing Trade Crypto on bitoftrade?
One can also swing trade crypto on a decentralized exchange like bitoftrade. To set up a trade, users first need to create an account and deposit funds into their MetaMask wallet. Once they have done this, they can then browse the available trading pairs and choose the one they wish to trade.
bitoftrade just like other DEX exchanges is a peer-to-peer trading platform that allows you to trade cryptocurrency without having to go through a centralized exchange; however, there are lots of features that you'll not find on another exchange available on bitoftrade. For example limit order, leverage trading, and stop losses.
Conclusion
However, no one is likely to tell you that swing trading is not easy. In fact, it's very difficult but possible to make a living swing trading cryptocurrency.
This is because there are a lot of things that can go wrong when you're swing trading. For example, you could make a bad trade and lose all of your money if you are not familiar with money management. Or, you could get caught in a losing streak and lose all of your money without applying risk management.
Technical analysis is a crucial skill for this job, but it also necessitates a thorough understanding of technical analysis and the ability to spot trends. Furthermore, you must be patient and disciplined. However, if you can accomplish all of these tasks, swing trading is an excellent method to generate money in the cryptocurrency market.


